SmartSeq2 scRNASeq QC Metrics
Sequencing QC metrics and its visualization can not only provide overall view of quality for experiment but also play important role in quality troubleshooting, library construction improvement.
Tables of metrics can provide an overview of alignment statistics,rna sequencing quality and more.
Alignment metrics can be used to provide overall idea of the quality of alignment for your libraries. One of important metrics is PCT_PF_ALIGNED which indicates the percentage of reads mapped to reference genome. Another important metrics is PF_MISMATCH_RATE, which can provide overall alignment quality.
RNA metrics provide important summary based on gene annotation. PCT_USABLEBASES indicates the percentage of bases mapped to transcriptome(mRNA+UTR regions). This metrics provide overall view of quality of RNA sequencing. High values in PCT_INTRONIC_BASES, PCT_INERGENIC_BASES and PCT_RIBOSOMAL_BASES indicate low quality or degraded RNA. High in MEDIAN_3PRIME_BIAS also indicates high chance of degraded RNA.

These metrics provide based information on insert sizes for paired-end library. This metrics can be used to ensure that pair-end libraries are constructed as expected.

These metrics provide level of duplication(post alignment). This is coordinates based method, not raw fastq data based method.

In this task, we applied a scRNA-Seq pipeline on a published dataset GSE47872. We selected single cell samples include primary Glioblastoma and Gliomasphere Cell Line cells. The sample counts are listed below:
| 25bp | 100bp | |
|---|---|---|
| Glioblastoma | 581 | 96 |
| Gliomasphere Cell Line | 195 | 0 |
We collected all metrics together and generated one table. We visualized several important metrics shown as below. First we examined metrics between two different celltype
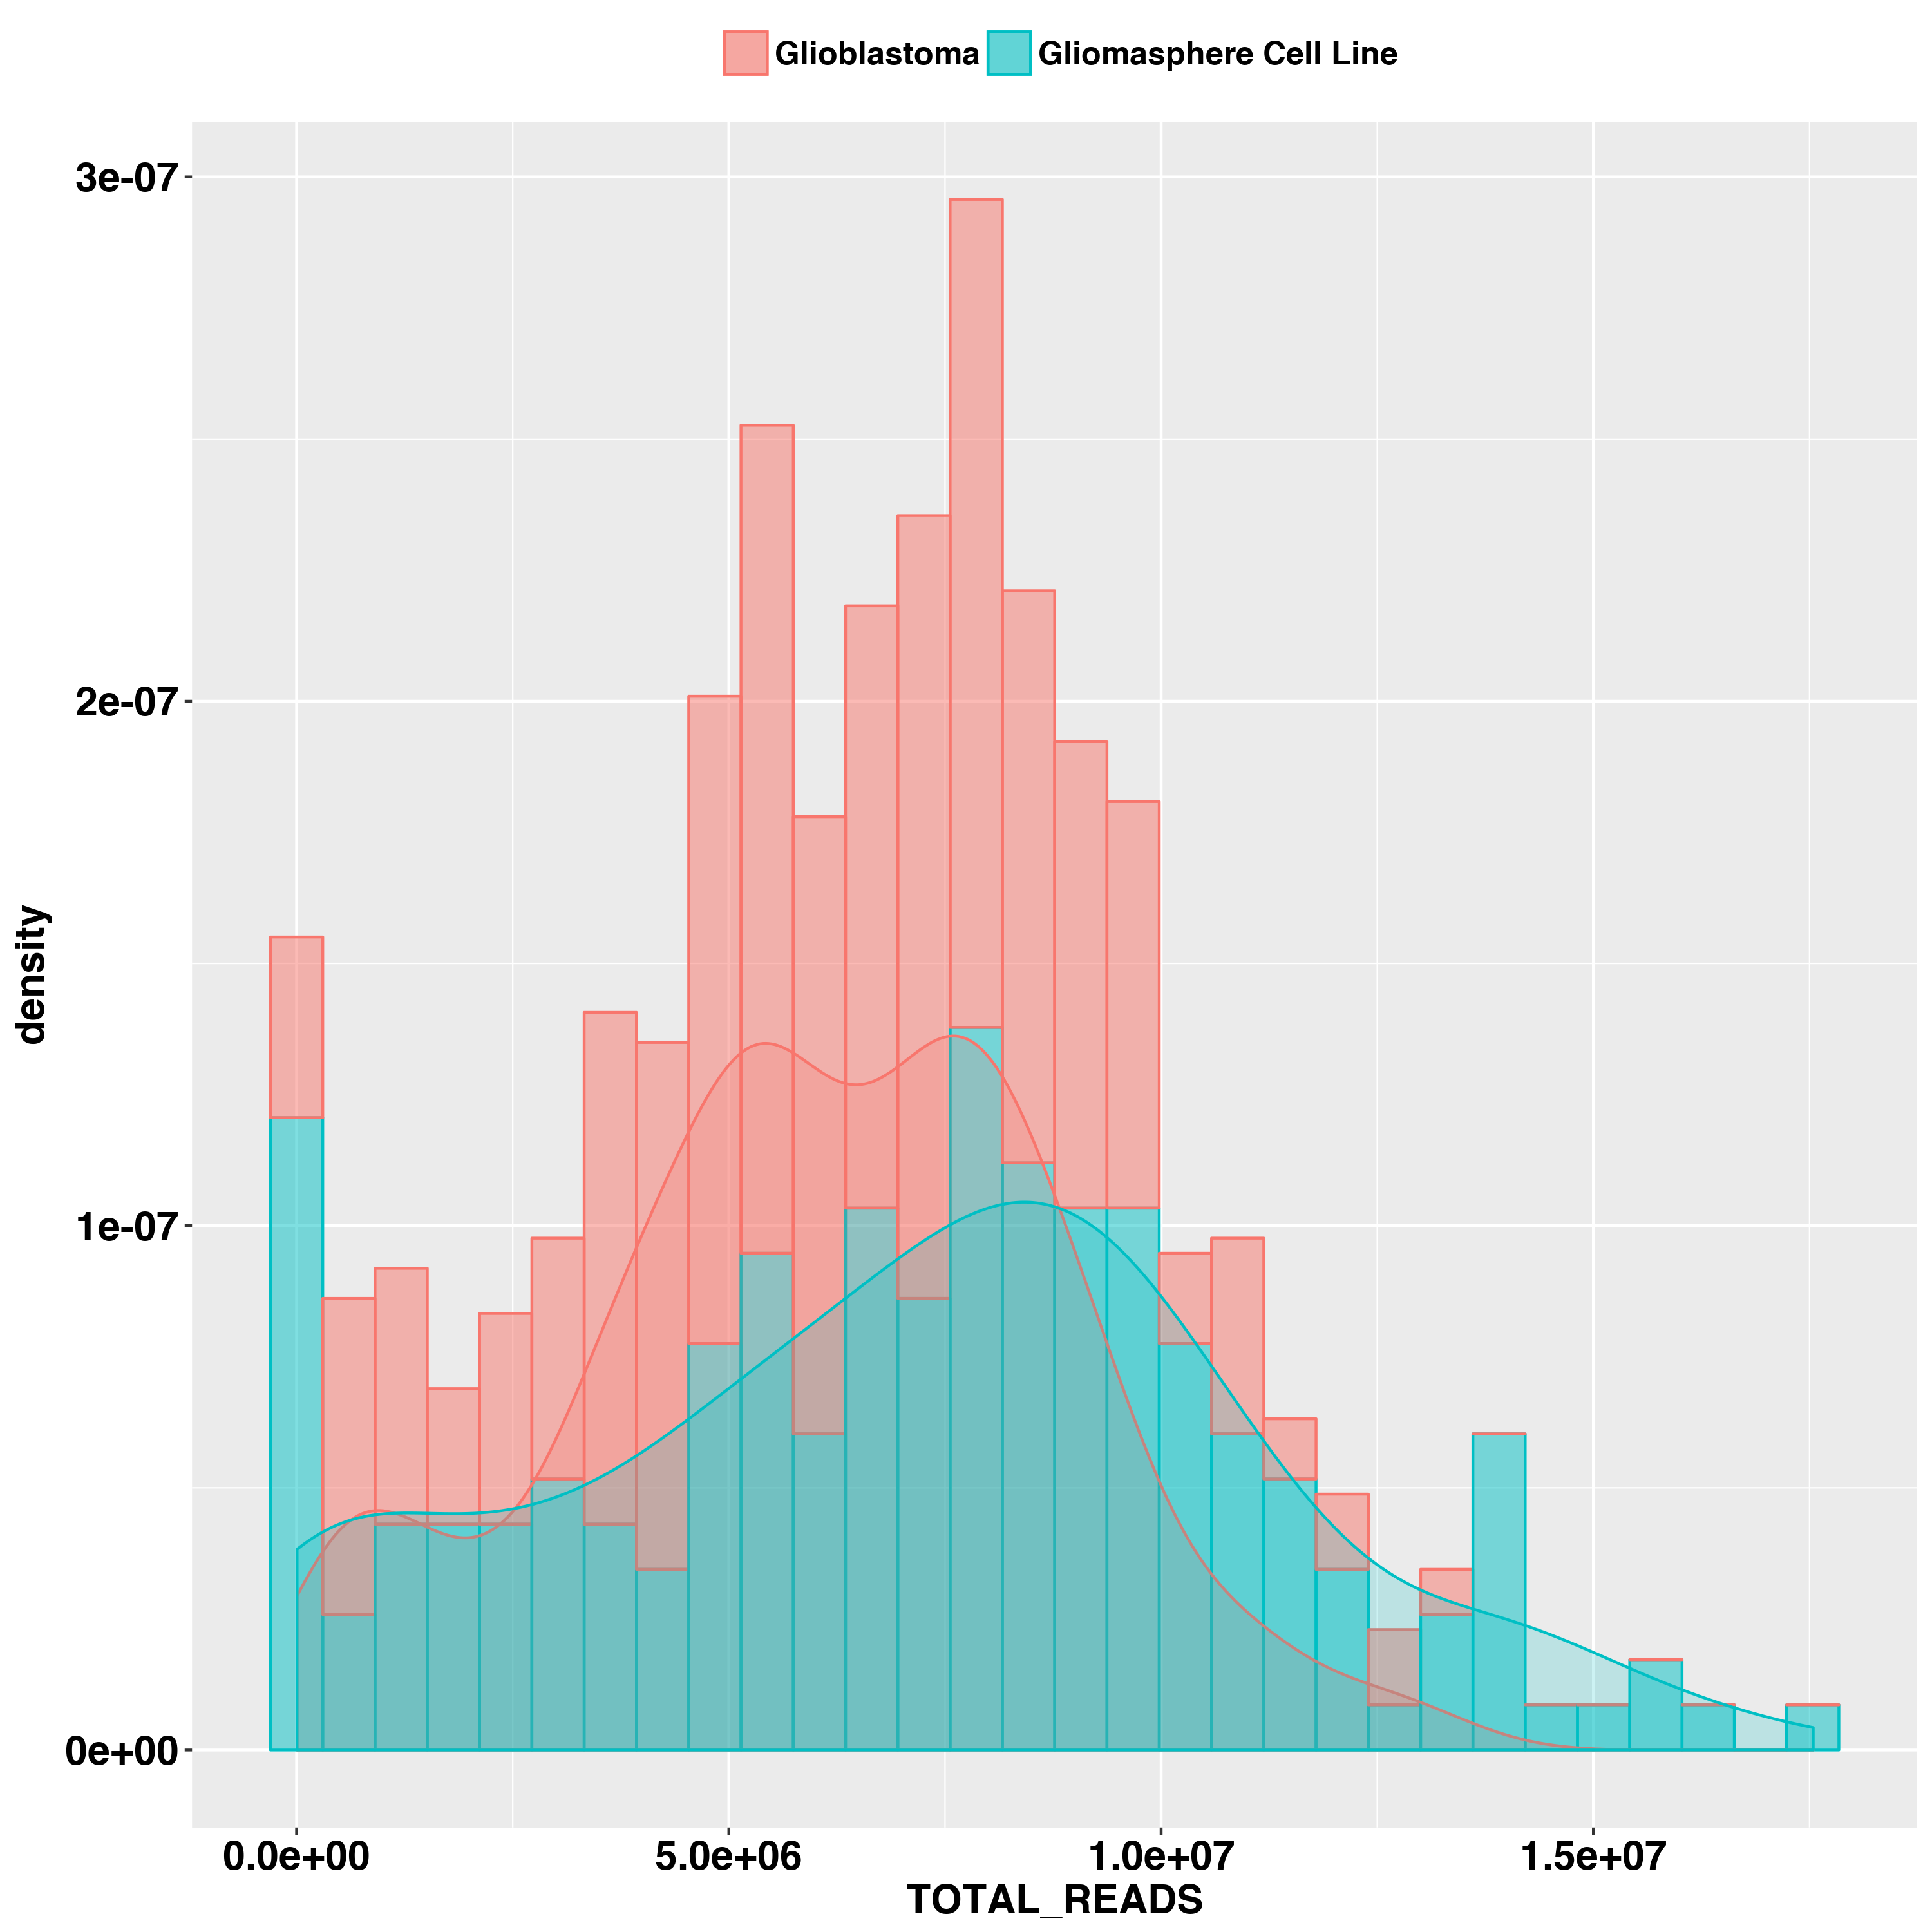
TOTAL_READS metrics' density plot shown in figure. there are evenly number of reads generated among two celltypes.
PCT_PF_READS_ALIGNED density plot. There is no significant difference between celltype but there is unusual peak at lower end, which indicate low alignment rate.

PF_MISMATCH_RATE density plot. primary cancer cell show an unusual peak at high mismatching rate.

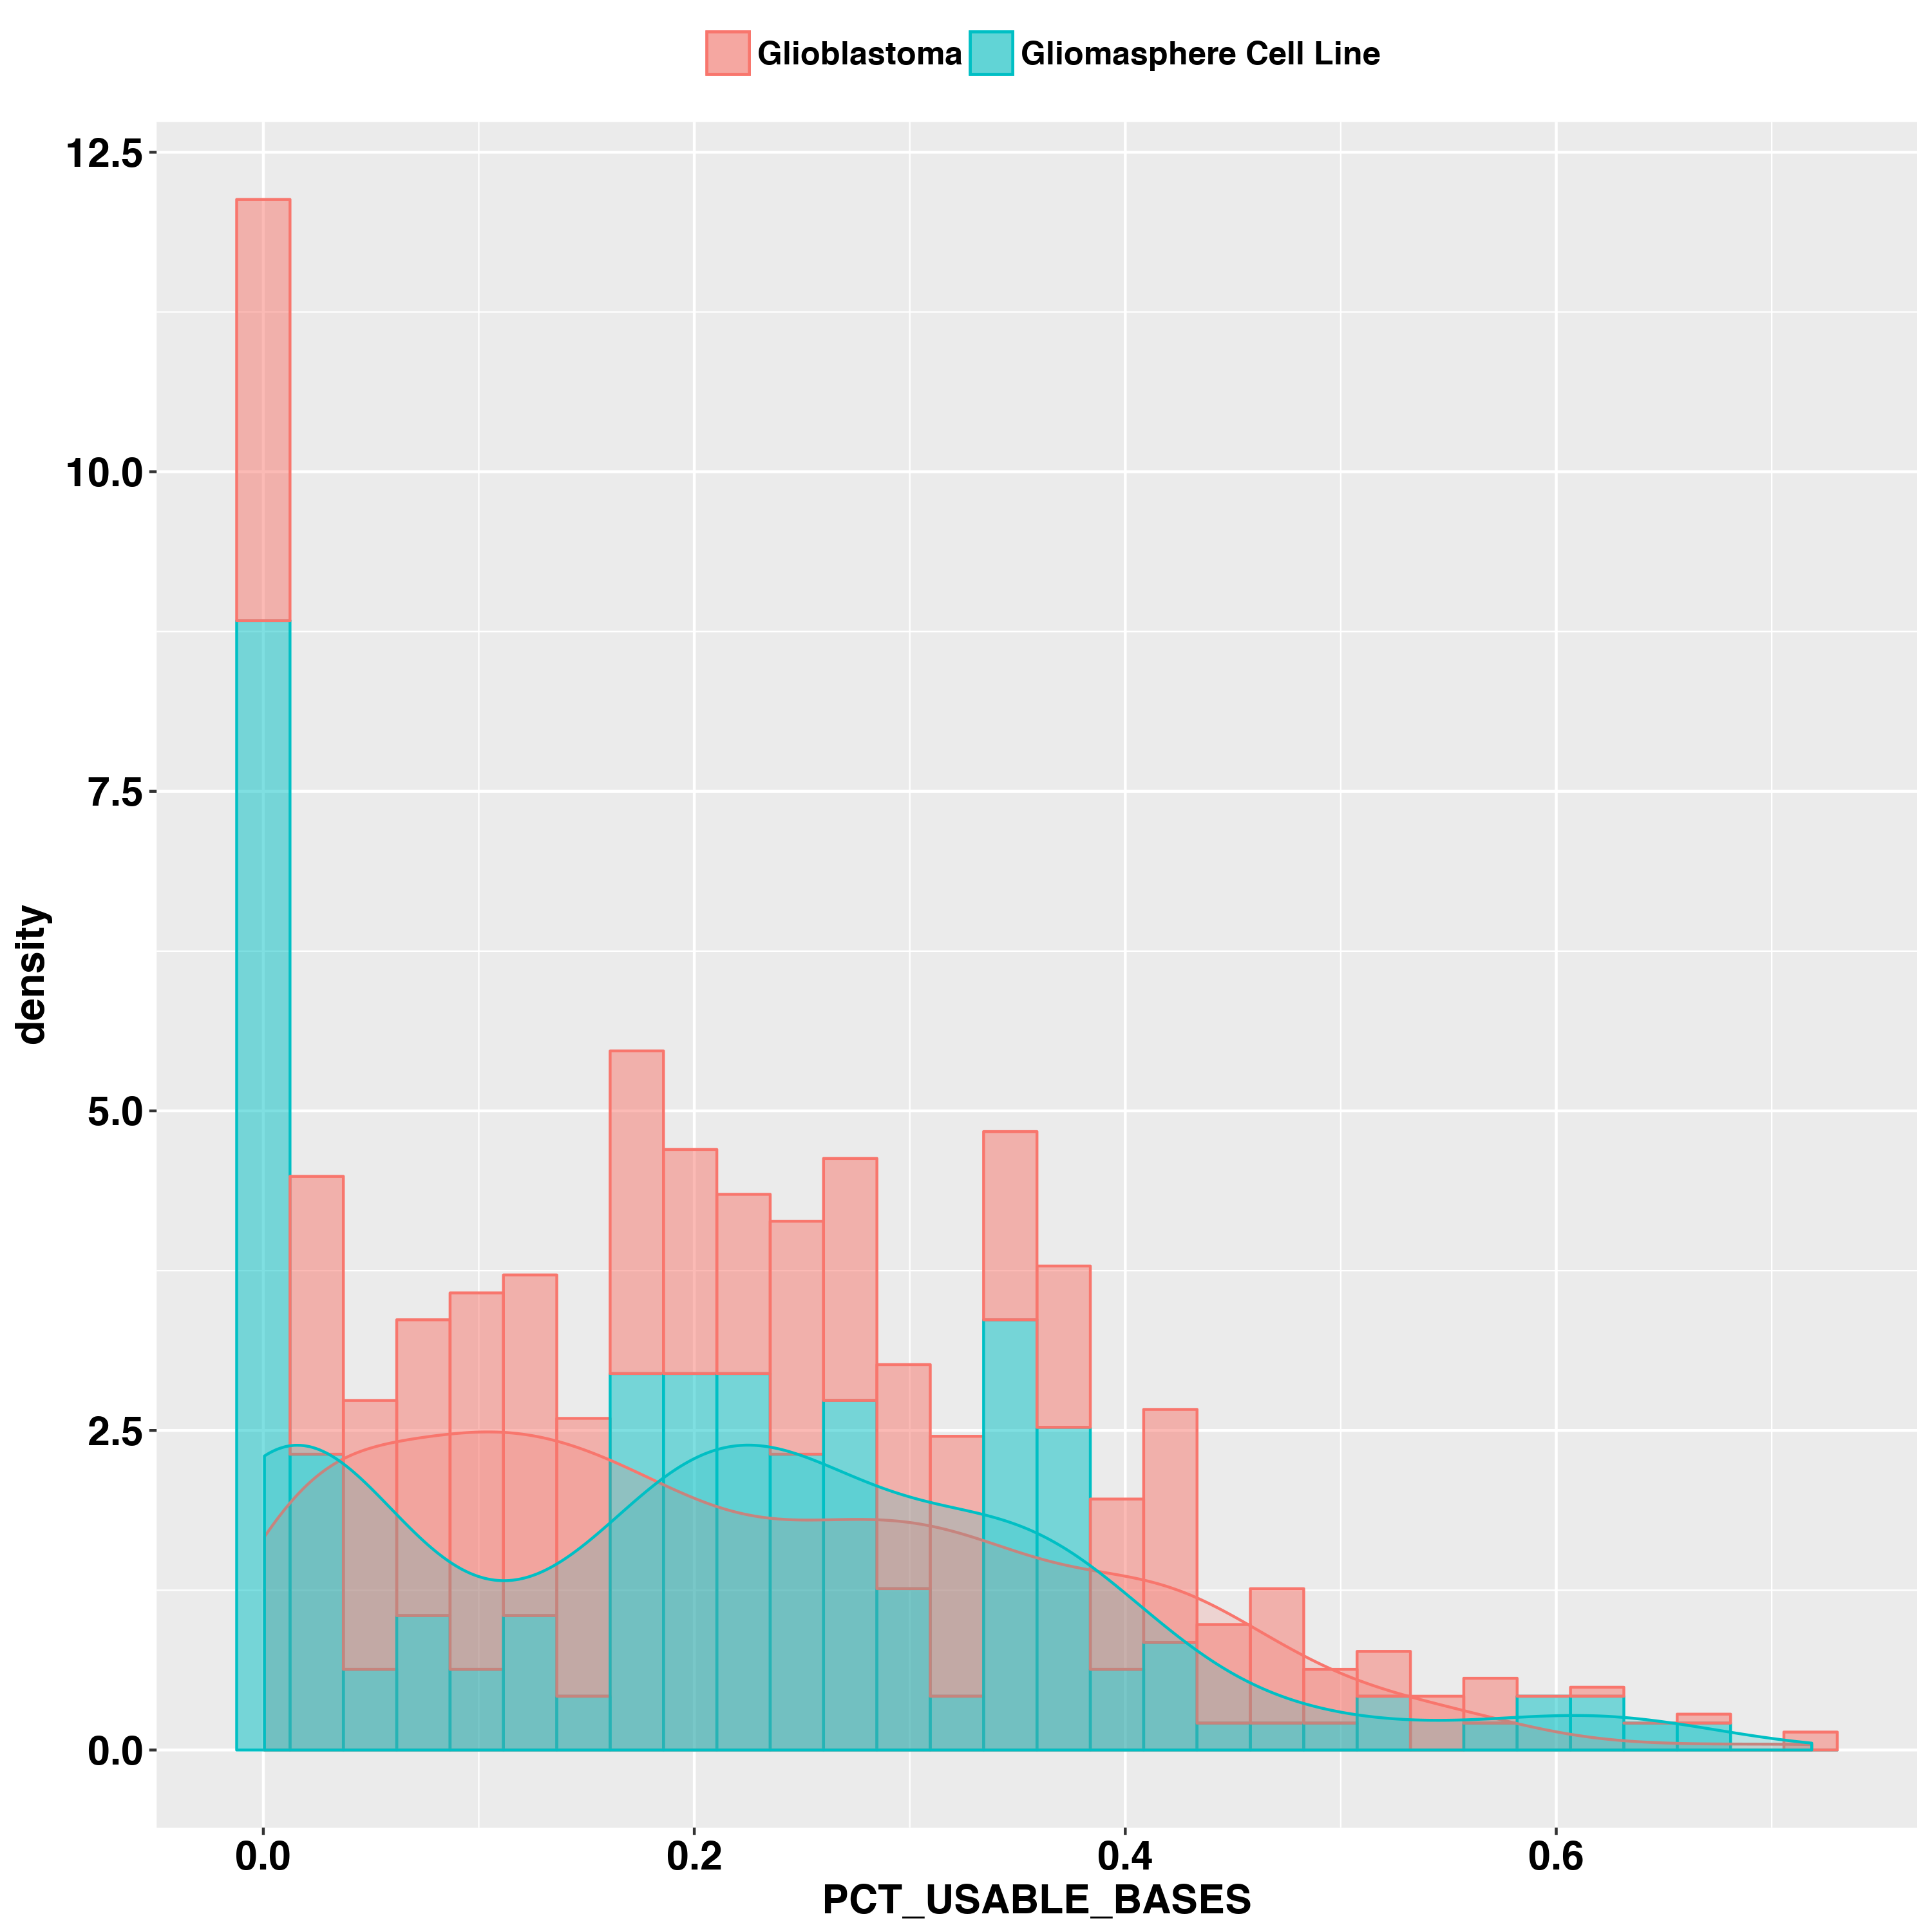
PCT_USABLE_BASES density plot.
PCT_RIBOSOMAL_BASES

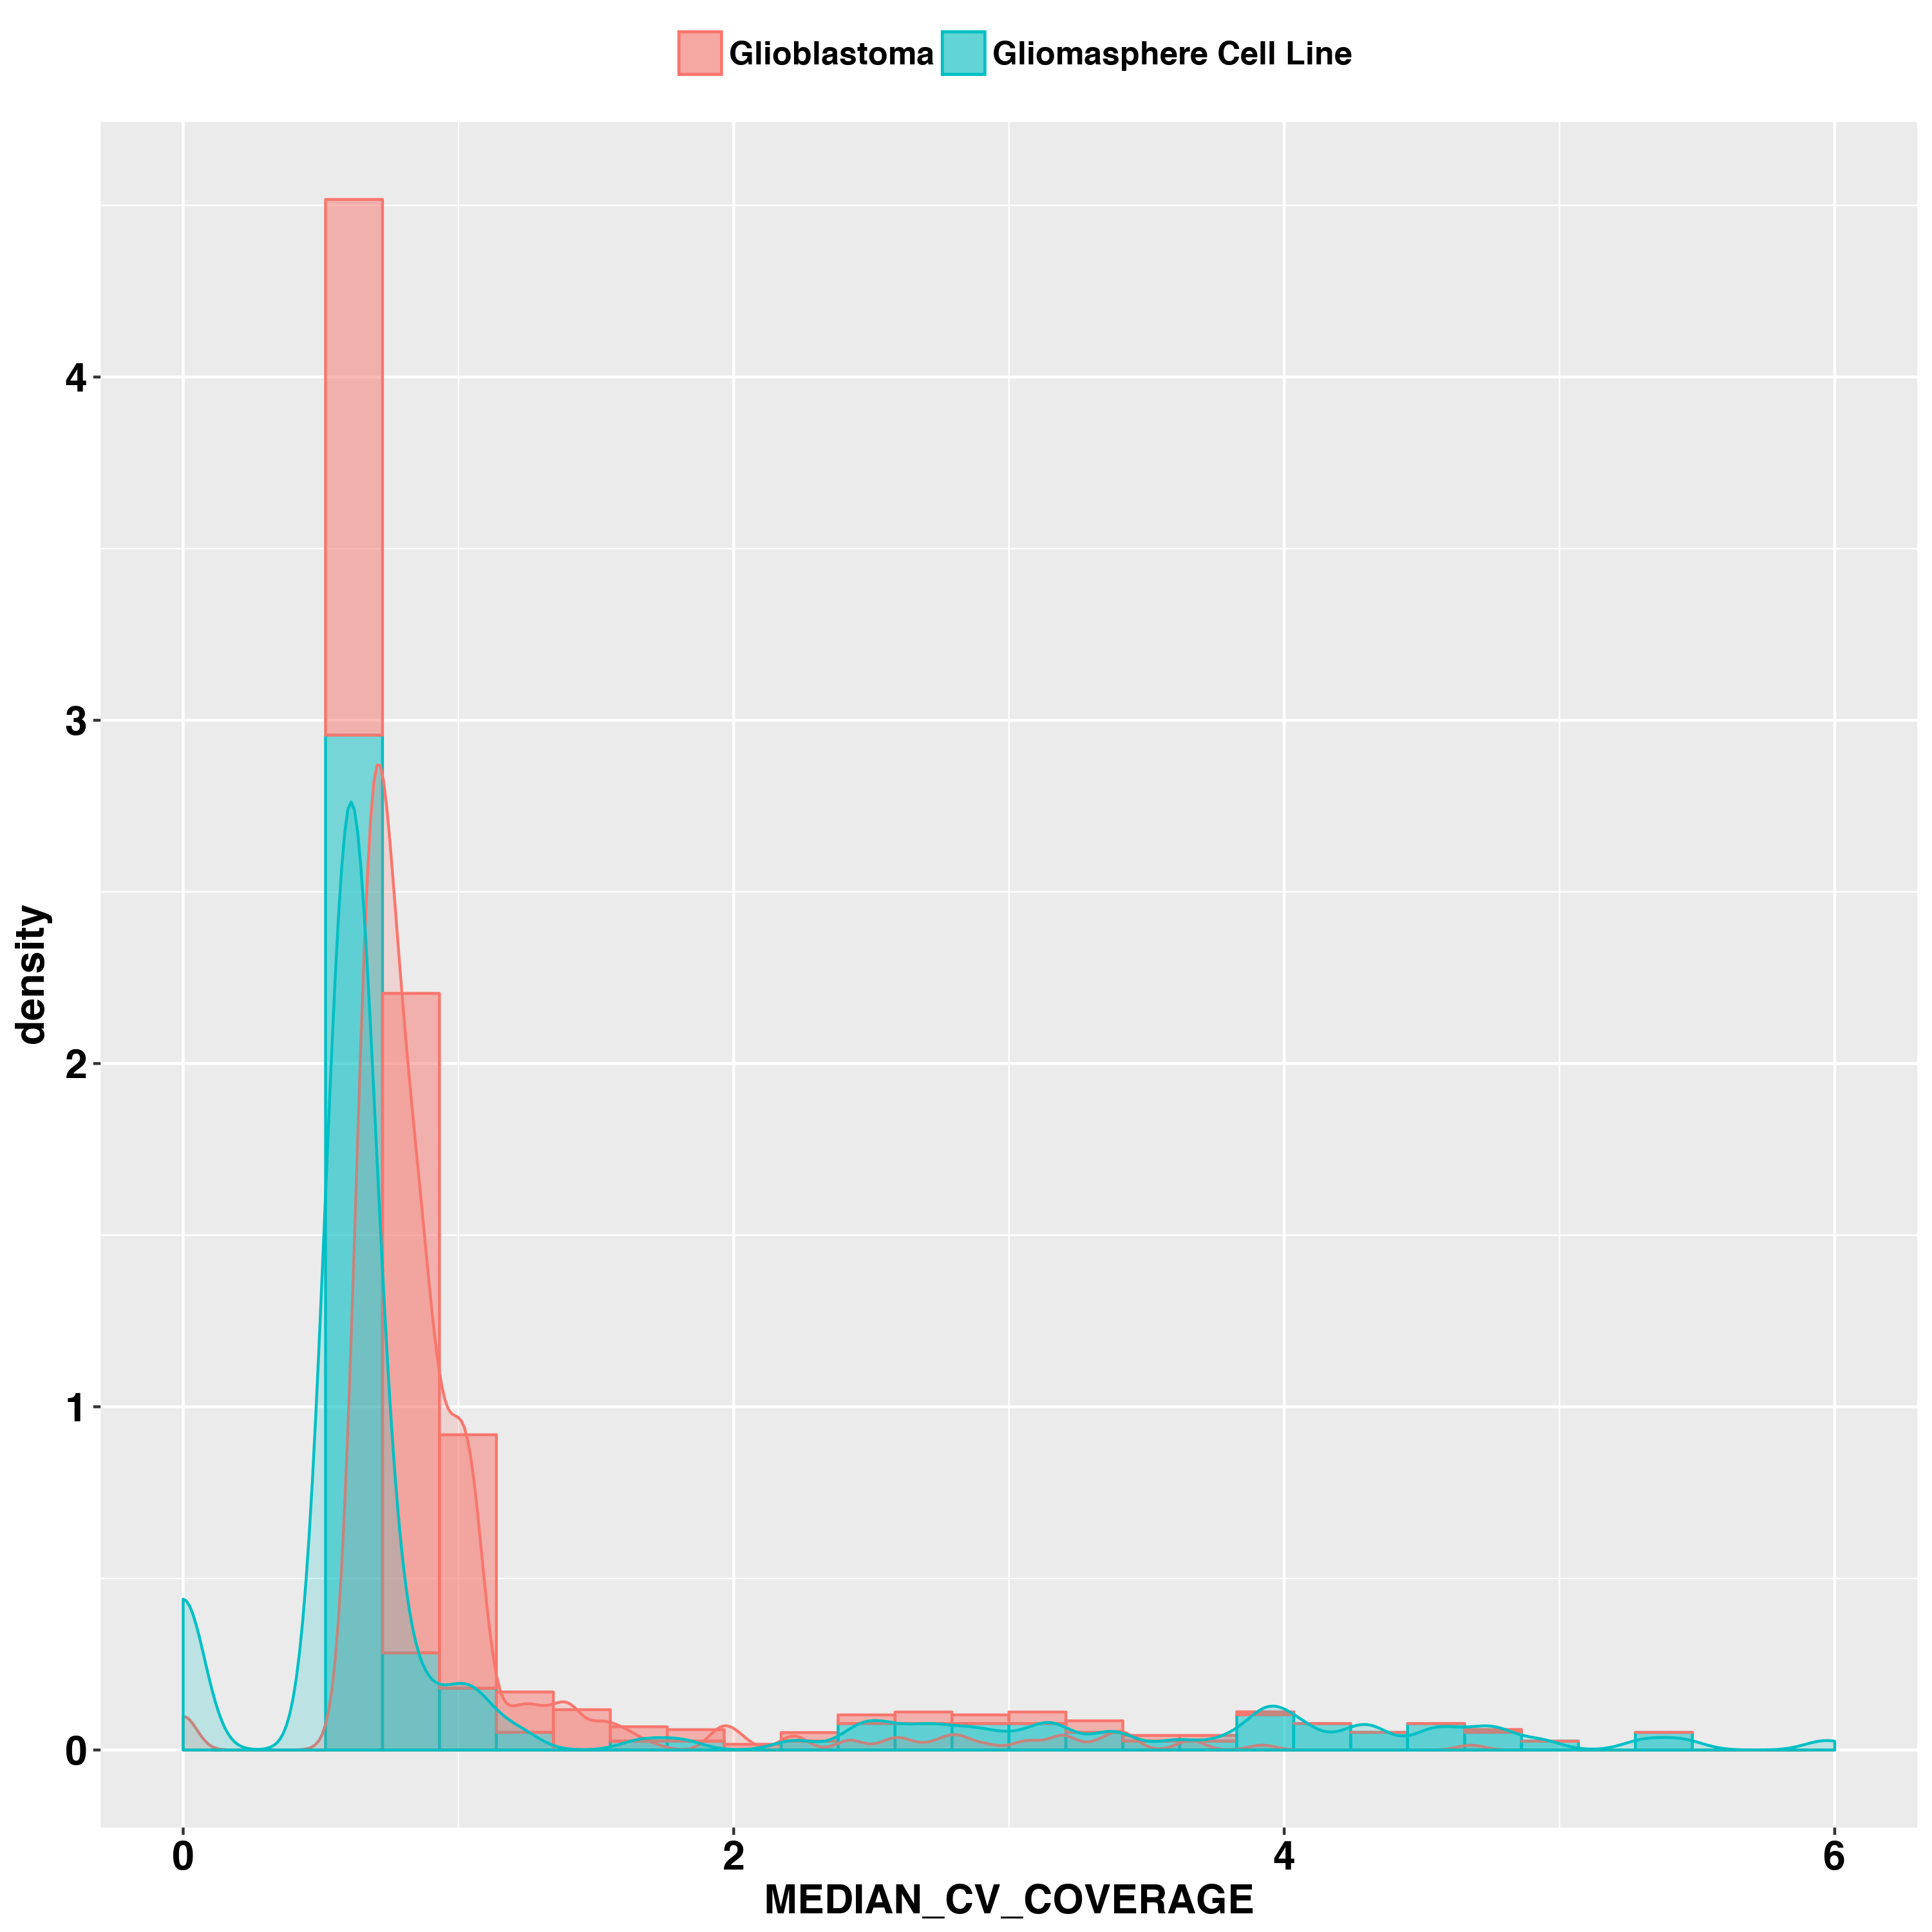
MEDIAN_CV_COVERAGE density plot. The median coefficient of variation (CV) or stdev/mean for coverage values of the 1000 most highly expressed transcripts. Low values is ideal
MEDIAN_3PRIME_BIAS and MEDIAN_5PRIME_BIAS. Majority samples have low 5' and 3' end bias but there is a long tail extend to high bias region which indicate there are degradation in some of samples.


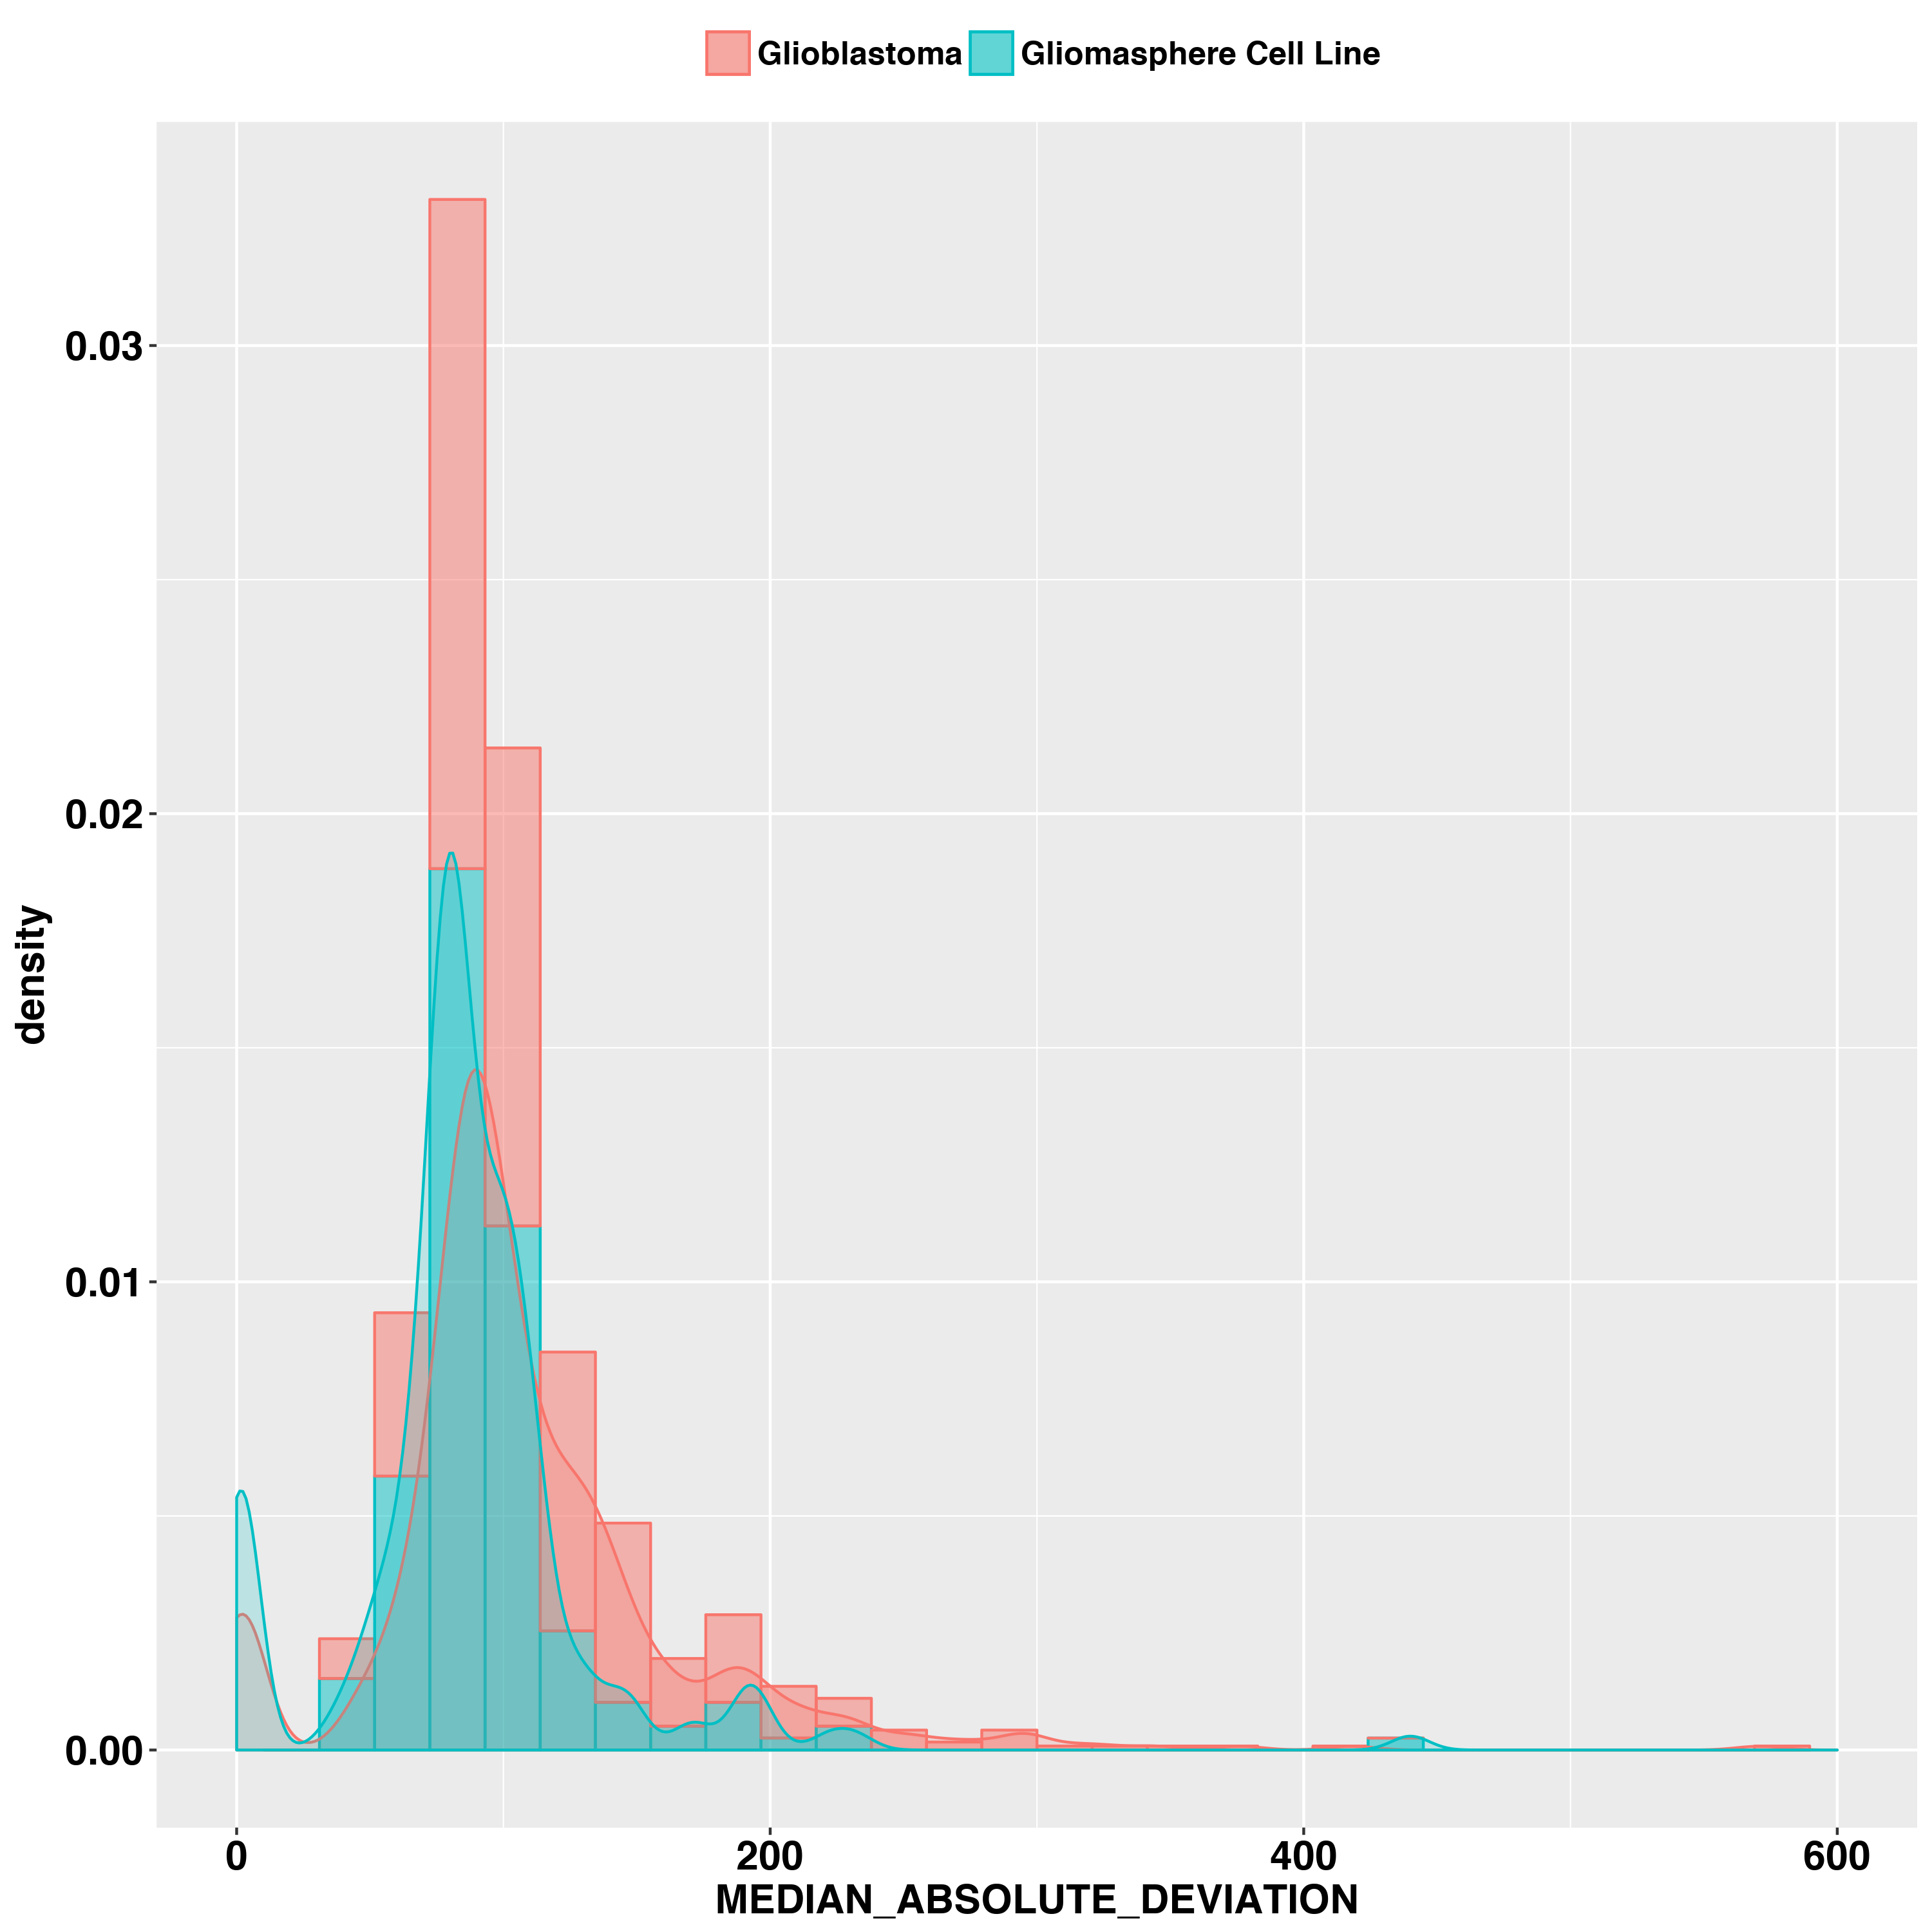
MEDIAN_INSERT_SIZE and MEDIAN_ABSOLUTE_DEVIATION both metrics fall into expected region, 200~400bp

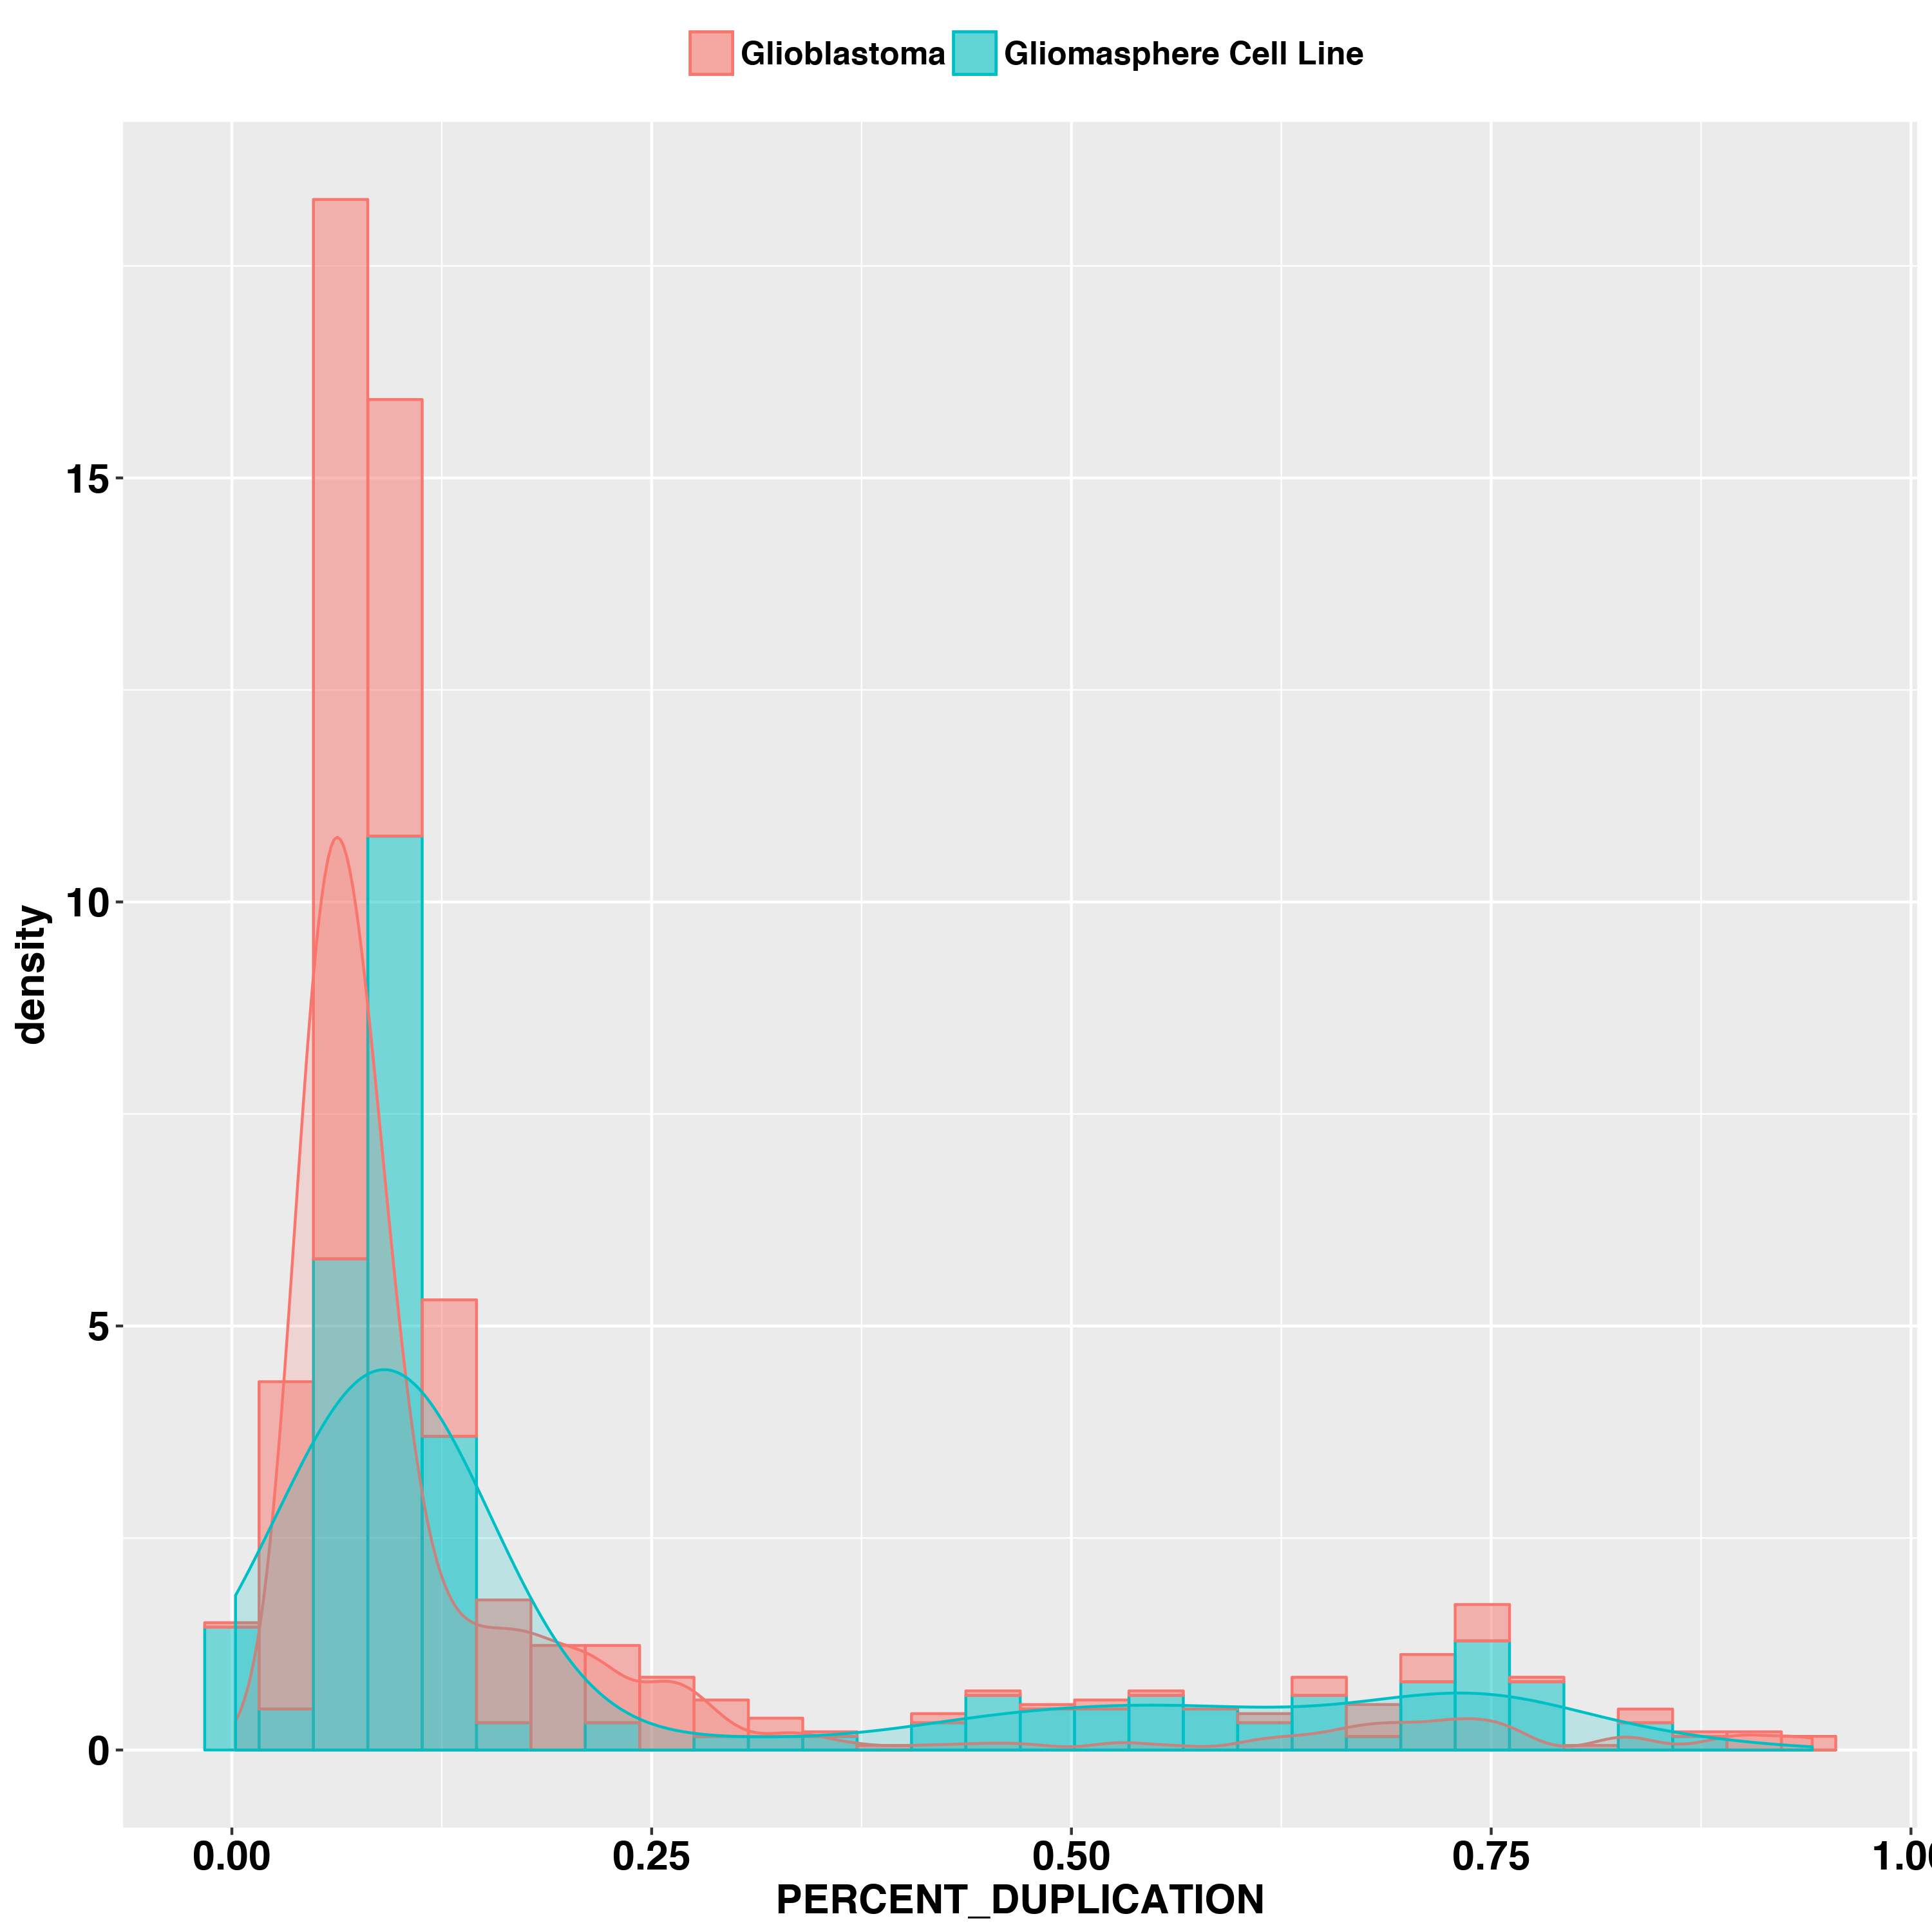
PERCENT_DUPLICATION