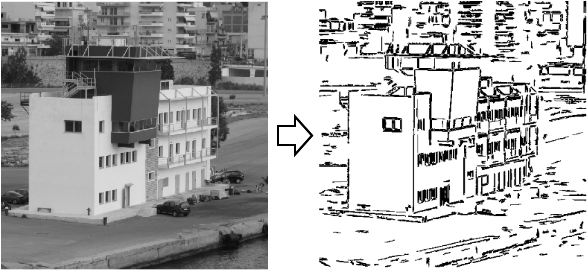
The image.LineSegmentDetector R package detects line segments in images.
- It contains 1 main function image_line_segment_detector. If you give it an image matrix with grey scale values in the 0-255 range, it will find lines in the image.
- The algorithm is defined in LSD: A Fast Line Segment Detector with a False Detection Control" by Rafael Grompone von Gioi, Jeremie Jakubowicz, Jean-Michel Morel, and Gregory Randall, IEEE Transactions on Pattern Analysis and Machine Intelligence, vol. 32, no. 4, pp. 722-732, April, 2010. https://doi.org/10.5201/ipol.2012.gjmr-lsd
- Mark that if you are looking in detecting lines, you might also be interested in https://github.com/bnosac/image/image.ContourDetector
Read in an image with values in the 0-255 range (pgm image: http://netpbm.sourceforge.net/doc/pgm.html)
library(image.LineSegmentDetector)
library(pixmap)
image <- read.pnm(file = system.file("extdata", "le-piree.pgm", package="image.LineSegmentDetector"), cellres = 1)
plot(image)
linesegments <- image_line_segment_detector(image@grey * 255)
plot(linesegments)
If you have another type of image (jpg, png, ...). Convert the image to pgm format before getting the 0-255 range or convert it to grey format before passing it on to the function.
library(magick)
f <- tempfile(fileext = ".pgm")
x <- image_read(system.file("extdata", "atomium.jpg", package="image.LineSegmentDetector"))
x <- image_convert(x, format = "pgm", depth = 8)
image_write(x, path = f, format = "pgm")

image <- read.pnm(file = f, cellres = 1)
linesegments <- image_line_segment_detector(image@grey * 255)
plot(image)
plot(linesegments, add = TRUE, col = "red")See instructions at https://github.com/bnosac/image
Need support in image recognition? Contact BNOSAC: http://www.bnosac.be


