This file summarizes accuracy test for loops of constant duration using the oclock.Timer class. Tests are done using the performance_test function (see Readme.md), e.g.
from oclock.performance import performance_test
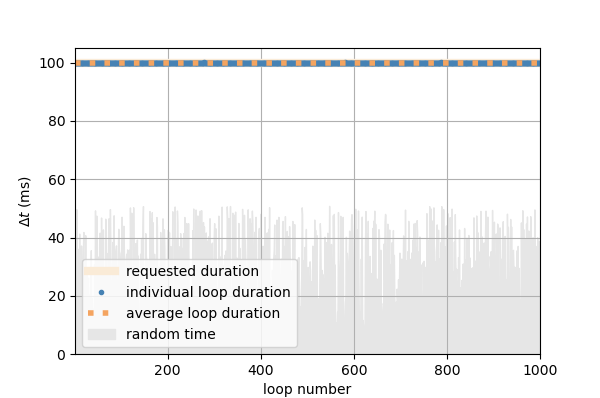
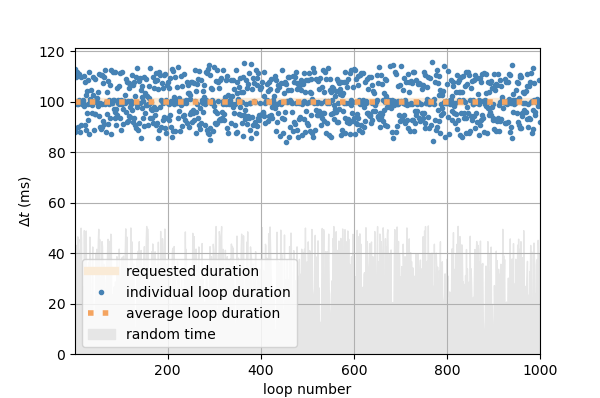
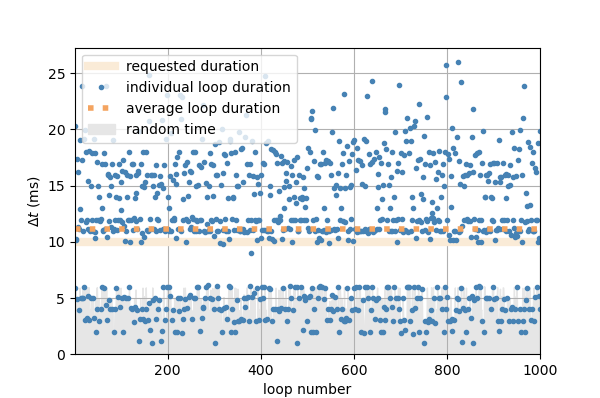
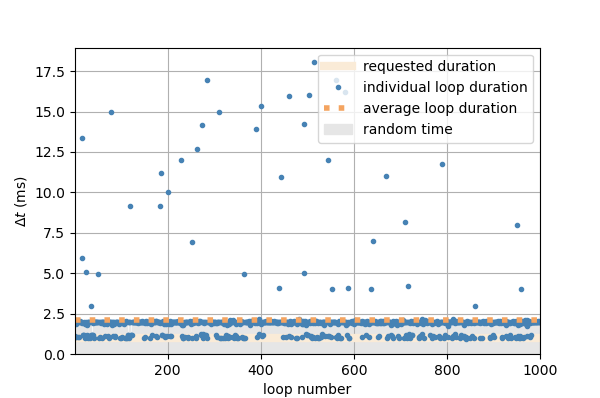
performance_test(dt=0.1, nloops=1000, fmax=0.5, plot=True, precise=True)Below are some results on timing accuracy in an Unix Environment (MacOS) and Windows, using nloops=1000, fmax=0.5 for various values of dt. Regular Timer means with precise=False while Precise Timer means with precise=True.
Requested dt (ms) |
1000 | 100 | 40 | 10 | 1 |
|---|---|---|---|---|---|
average dt - requested dt (ms) |
0.0012 | 0.00012 | 0.00016 | 0.00005 | 0.00023 |
standard deviation in dt (ms) |
0.48 | 0.36 | 0.31 | 0.23 | 0.08 |
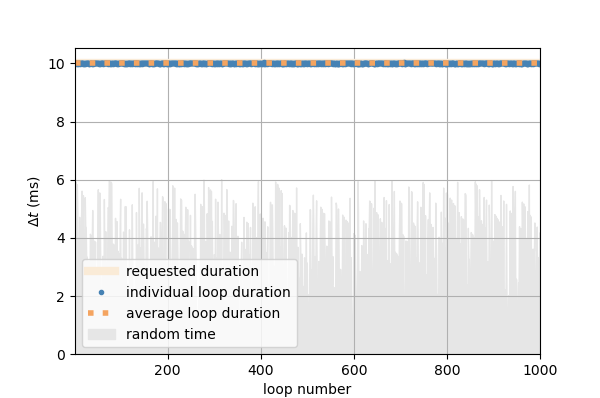
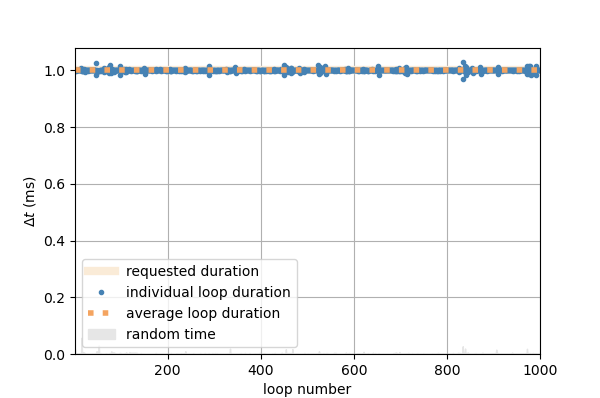
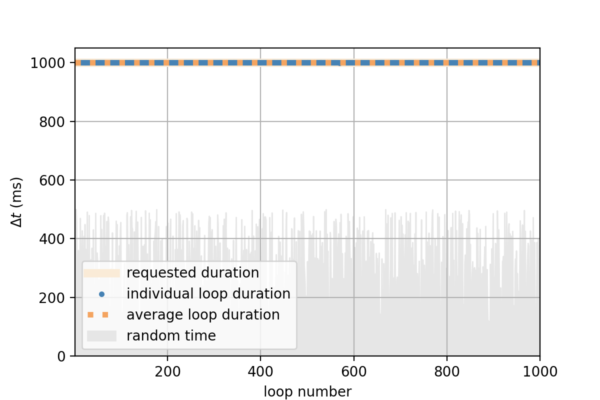
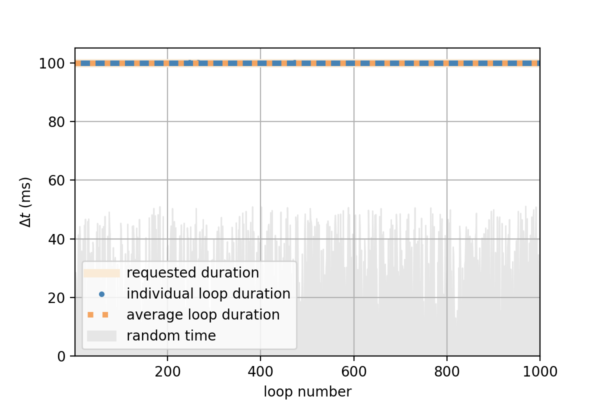
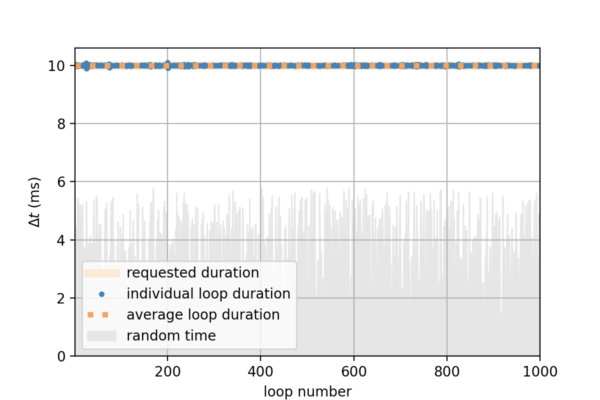
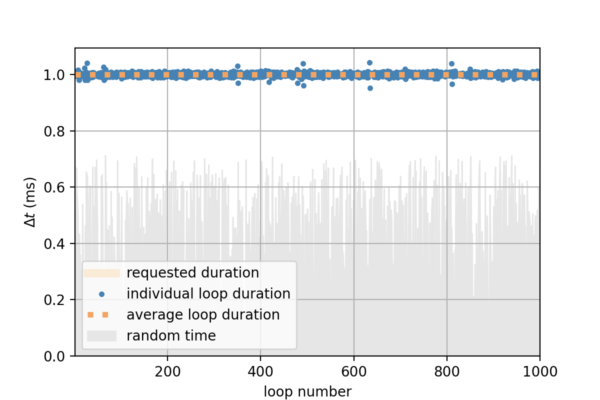
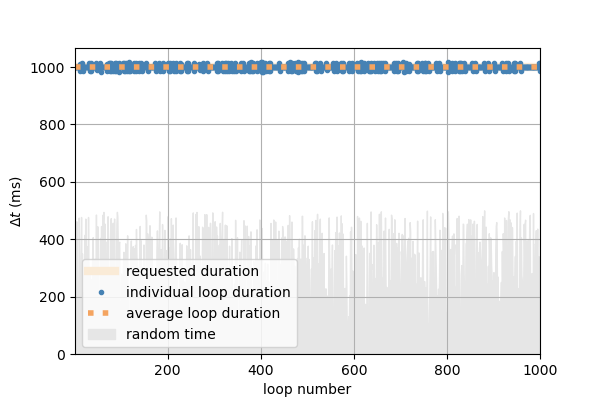
Corresponding graphs:
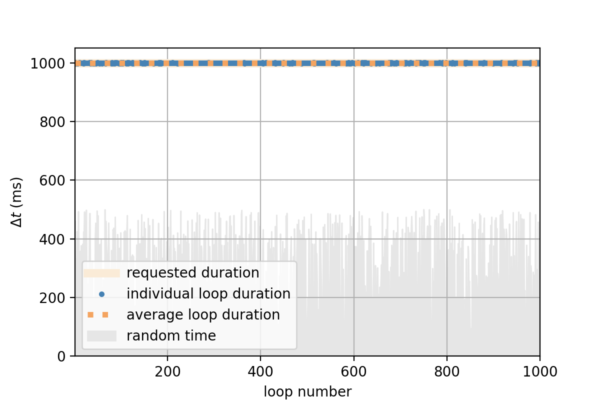
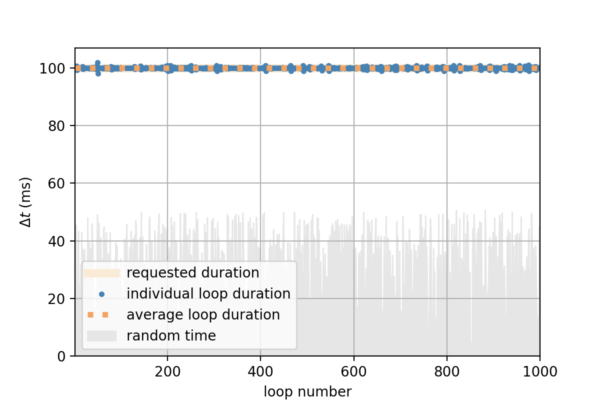

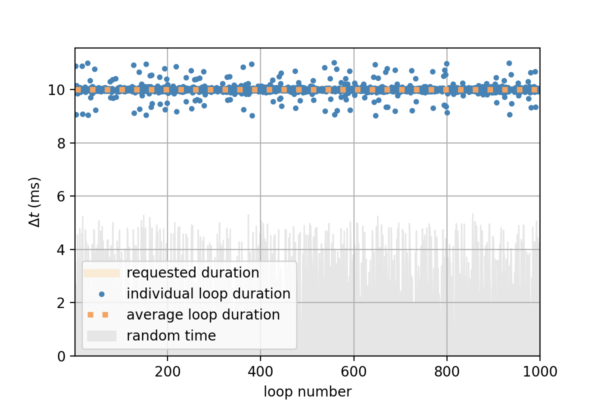
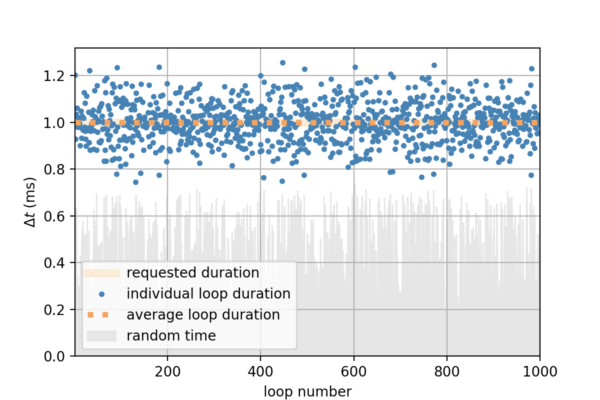
Requested dt (ms) |
1000 | 100 | 40 | 10 | 1 |
|---|---|---|---|---|---|
average dt - requested dt (ms) |
3.6E-5 | 3.4E-5 | 2.8E-5 | 3.0E-5 | 1.2E-5 |
standard deviation in dt (ms) |
0.0118 | 0.0104 | 0.0117 | 0.0105 | 0.0073 |

Requested dt (ms) |
1000 | 100 | 40 | 10 | 1 |
|---|---|---|---|---|---|
average dt - requested dt (ms) |
0.014 | 0.0015 | 0.0013 | 1.2 | 1.1 |
standard deviation in dt (ms) |
7.0 | 7.1 | 7.0 | 5.6 | 1.9 |

Requested dt (ms) |
1000 | 100 | 40 | 10 | 1 |
|---|---|---|---|---|---|
average dt - requested dt (ms) |
1.3E-5 | 1.5E-5 | 1.6E-5 | 6.7E-6 | 1.5E-6 |
standard deviation in dt (ms) |
0.0066 | 0.0100 | 0.0088 | 0.0068 | 0.0036 |