LLDB的文档不太完善(比如想拓展自定义命令行),暂倾向于使用GDB
之前使用LLDB,但是拓展时遇到了一些奇怪的问题,例如:无法使用PDB ;以及其相关的文档和案例不足;CLion也暂时只支持Bundled LLDB(使用第三方库时需要一些migration)。于是回归GDB。暂时感觉LLDB有的功能(自己用过的功能),GDB也有。
修改一个变量的值(CLion中对应的快捷键为F2)
(gdb) set var width=47# 某行打断点
(gdb) break linenum
# 具体到某个文件
(gdb) break filename:linenum
# 具体到某个函数
(gdb) break filename:function| 命令行 | abbreviation / example | 作用 |
|---|---|---|
| python-interactive [command] | pi | 进入Python交互模式 |
| python [command] | py [command] | 执行Python命令行 |
| break [line] | break 23 | 打断点 |
| info vtlb | — | 查看虚函数表 |
| print <variable_name> | — | 查看变量 |
| info threads | — | 查看线程信息 |
| info locals [variable_name] | — | 查看函数栈的局部变量 |
- 自定义配置文件:GEF;GDB 配置文件
- 保存历史命令,默认的历史命令行导出路径为
~/.gdb_history
$ echo "set history save on" >> ~/.gdbinit$ echo "set print thread-events off" >> ~/.gdbinit$ echo "set extended-prompt \w (gdb) " >> ~/.gdbinit- 隐藏启动时的提示信息和版权信息,details
# 方案一(CLI):设置别名
$ alias gdb="gdb -q"

# 方案二(配置文档):注意不是gdbinit (from gdb 11)
$ echo "set startup-quietly on" >> ~/.gdbearlyinit使用 disassemble 进一步看出现 dump core 出现的汇编位置
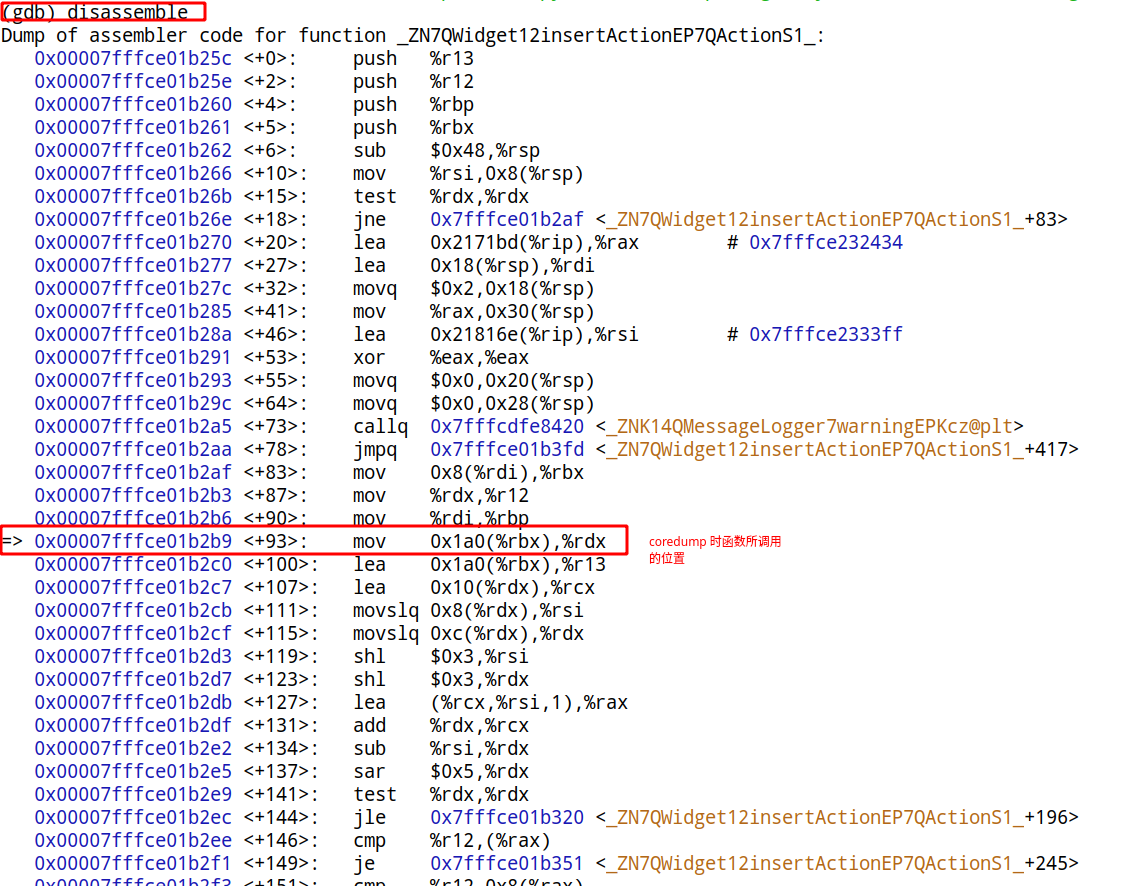
# 查看调用栈
(gdb) backtrace
(gdb) where
(gdb) info stack# 切换到某一帧
(gdb) f <num>
# 查看该帧的局部变量
(gdb) info locals
# 查看形参
(gdb) info args# 查看链接的动态库
$ info share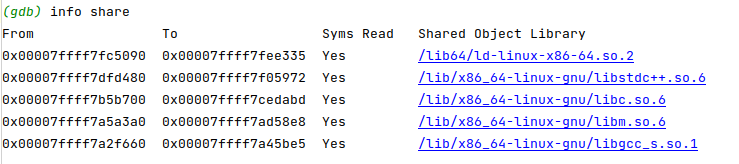
# 查看已有的pretty printer,包括关闭的
(gdb) info pretty-printer
Print the list of installed pretty-printers. This includes disabled pretty-printers, which are marked as such.

# 关闭pretty printer
(gdb) disable pretty-printer

# 启动pretty printer
(gdb) enable pretty-printer$ gdb python
(gdb) set args <python文件名>
(gdb) run (gdb)- 一般会使用
regex来判断输入变量的类型是否符合需求
def vec_lookup_function(val):
    lookup_tag = val.type.tag
    if lookup_tag == None:
        return None

    regex = re.compile("^.*vector_base<.*,.*>$")
    if regex.match(lookup_tag):
        return VectorPrinter(val)

return None- pretty printer for std vector:正则,迭代读数据(dereference)部分很OK
- 启动GDB调试
# 追加tag
launch-prefix="gdb -ex run --args"

# option:
# -ex <command> 执行给定的GDB command- 查看gdb如何处理信号(
Pass to program即让程序执行完信号回调函数后,程序才暂停)
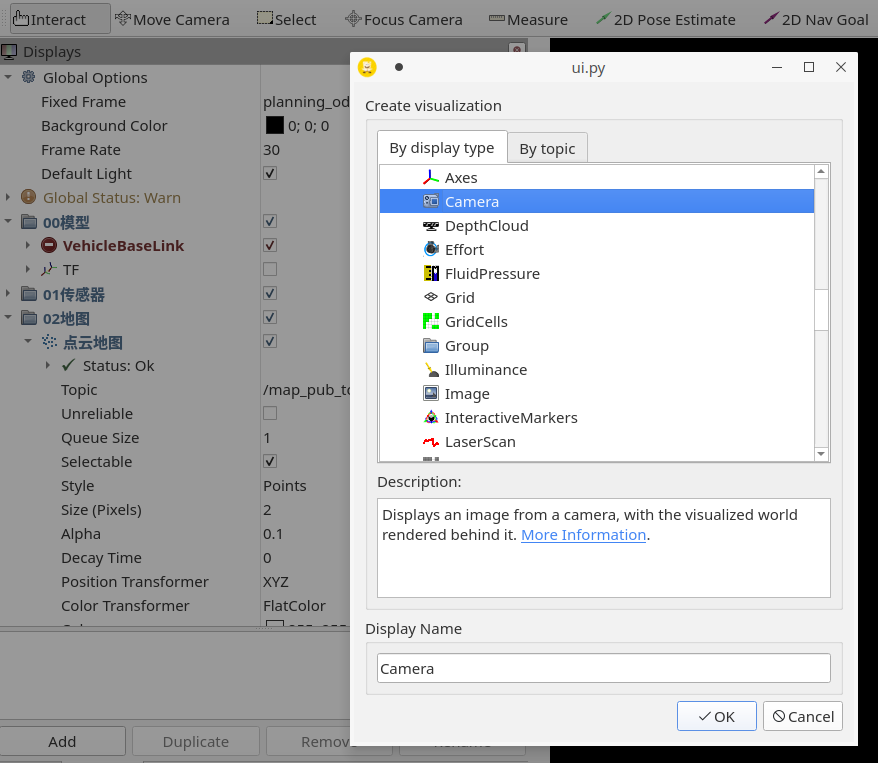
诊断rviz段错误
- ROS rviz增加
camera或imagedisplay时,会出现段错误(segmentation fault)
步骤一:执行程序
$ gdb python
(gdb) run <py_file>.py
步骤二:添加display触发异常

步骤三:查看调用栈的情况,可定位到是哪个函数产生段错误(加上full会同时输出局部变量)
(gdb) bt full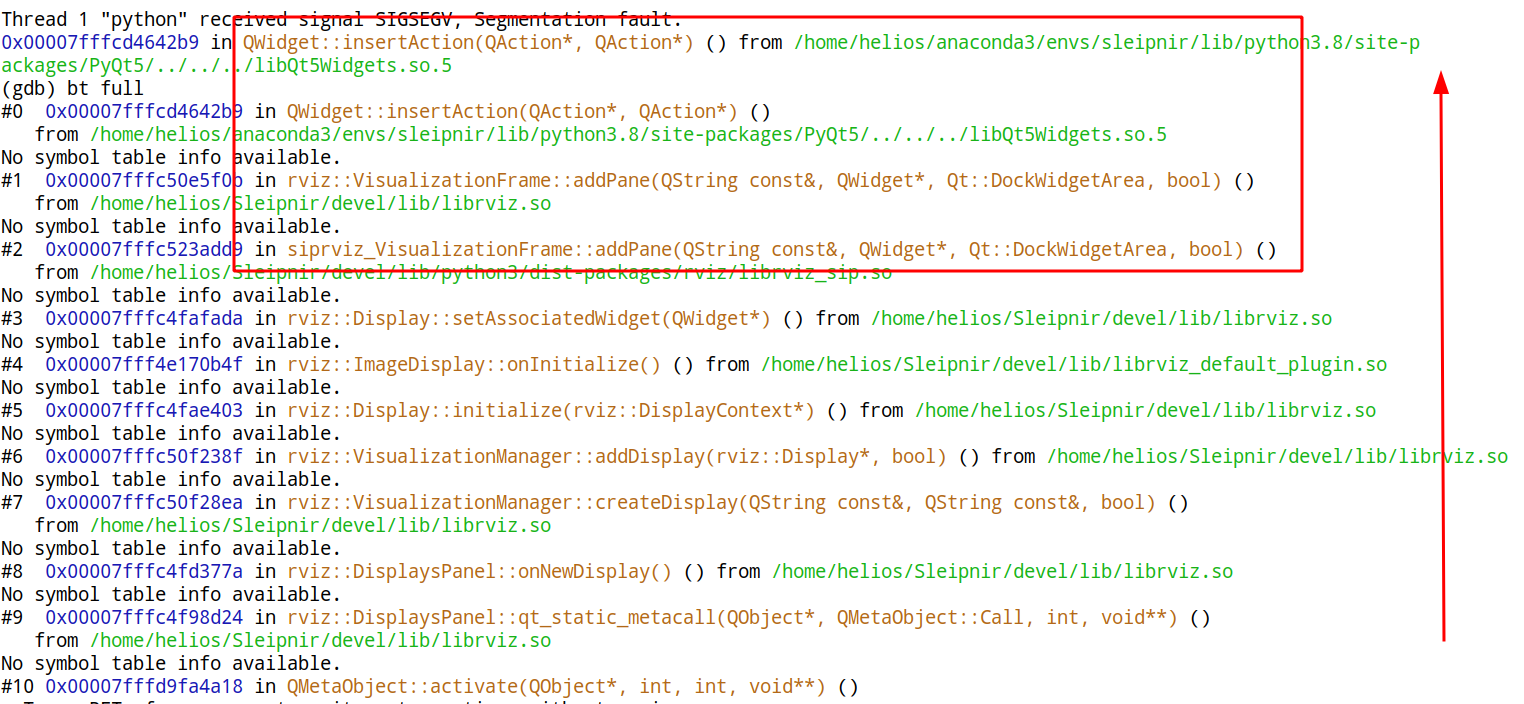
原因未知,可通过下发相关信号解决
$ kill -CONT <pid of the process>暂时没感觉新颖的地方
- Install
$ pip install gdbgui- Usage(Youtube)
$ gdbgui