-
Notifications
You must be signed in to change notification settings - Fork 6
/
Copy pathtoolbox_ecosystem.Rmd
227 lines (120 loc) · 19.1 KB
/
toolbox_ecosystem.Rmd
1
2
3
4
5
6
7
8
9
10
11
12
13
14
15
16
17
18
19
20
21
22
23
24
25
26
27
28
29
30
31
32
33
34
35
36
37
38
39
40
41
42
43
44
45
46
47
48
49
50
51
52
53
54
55
56
57
58
59
60
61
62
63
64
65
66
67
68
69
70
71
72
73
74
75
76
77
78
79
80
81
82
83
84
85
86
87
88
89
90
91
92
93
94
95
96
97
98
99
100
101
102
103
104
105
106
107
108
109
110
111
112
113
114
115
116
117
118
119
120
121
122
123
124
125
126
127
128
129
130
131
132
133
134
135
136
137
138
139
140
141
142
143
144
145
146
147
148
149
150
151
152
153
154
155
156
157
158
159
160
161
162
163
164
165
166
167
168
169
170
171
172
173
174
175
176
177
178
179
180
181
182
183
184
185
186
187
188
189
190
191
192
193
194
195
196
197
198
199
200
201
202
203
204
205
206
207
208
209
210
211
212
213
214
215
216
217
218
219
220
221
222
223
224
225
226
227
# Toolbox Ecosystem {#toolbox-ecosystem}
## Overview
Welcome to the OHI Toolbox, the engine behind all OHI assessments. The Toolbox is an ecosystem of R scripts and data files, organized in folders and sub-folders. The information in your repository will interact with an `R` package called `ohicore`, which does the core operations to calculate OHI scores.
In this chapter, we will learn how the Toolbox is structured - where you would store data, modify models, make calculations, as well as record decision-makings. The Toolbox ecosystem introduced here is the same in any assessment. So, if you would like to explore your own repository or an existing repository such as the [Gulf of Guayaquil assessment](http://github.com/OHI-Science/gye) you can navigate through those repositories in the same way.
This tutorial will take roughly 30 minutes.
Let's get started!
## Prerequisites
We will explore these files together on your own computer, but we will not be calculating scores in this chapter. If you will be using the Toolbox, please clone the repository to your computer with the following steps. You can clone either the toolbox-demo or your assessment's repository. If you will not be calculating scores, you do not need to clone anything; please follow along online at GitHub <https://github.com/OHI-Science/toolbox-demo> or with your assessment's repository.
1. Have up-to-date versions of `R` and RStudio and have RStudio configured with Git/GitHub
- https://cloud.r-project.org
- http://www.rstudio.com/download
- http://happygitwithr.com/rstudio-git-github.html
1. Fork the **toolbox-demo** repository into your own GitHub account by going to https://github.com/OHI-Science/toolbox-demo, clicking "Fork" in the upper right corner, and selecting your account
1. Clone the **toolbox-demo** repo from your GitHub account into RStudio into a folder called "github" in your home directory (filepath "~/github")
1. Get comfortable: be set up with two screens if possible. You will be following along in RStudio on your own computer while also watching an instructor's screen or following this tutorial.
Now you have set up your computer, let's open the `toolbox-demo` repository on your computer, and go from there.
You can also watch a video recording of the following, identified in the OHI Onboarding Book: <http://ohi-science.org/onboarding/conduct>.
## Repository home folder (ex: `toolbox-demo`)
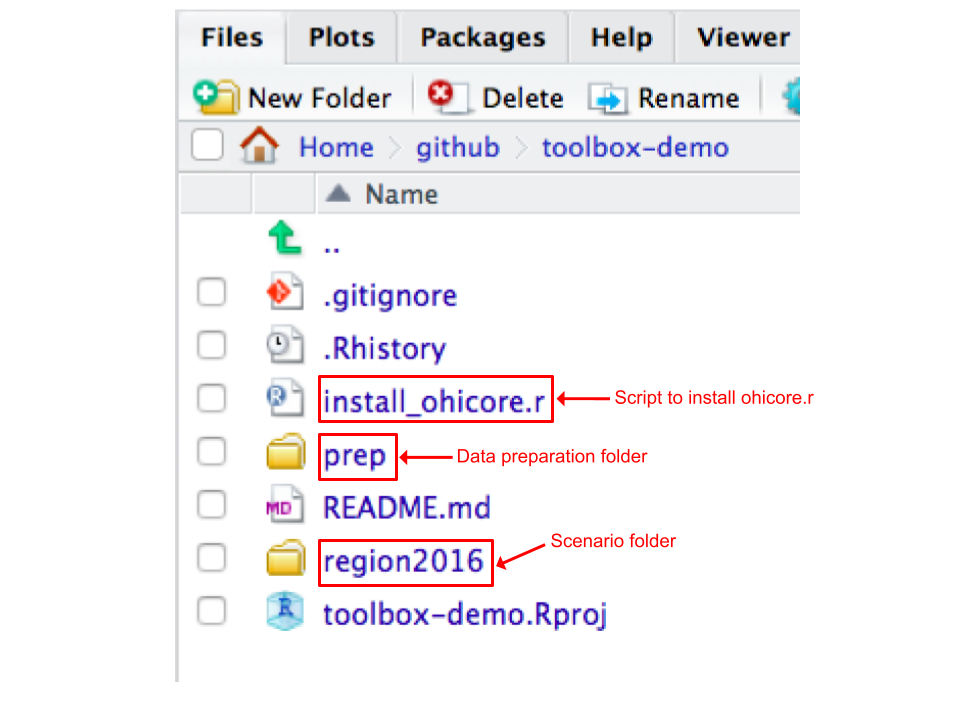
When you first open the repository, you'll encounter the following files and folders. *Note*: if you have a starter repository, you'll have a `prep` folder but not a `scenario` folder (which is `region2016` in the screenshot below).

Overall, all the main files you will see are either of the two file types:
- **.csv** files contain data inputs or configuration information.
- **.R** or **.Rmd** scripts are written in the programming language R and use data inputs for processing and calculations.
Among all the files on your screen, the most important files are:
- `prep` is a data preparation folder. This is where you will store raw and/or intermediate data, and the R scripts you create to explore and format those data, and make trial runs of different models. You will spend roughly the first half of your time during your assessment here.
- `region2016` is the scenario folder. The scenario folder has the architecture of the OHI Toolbox that is needed to calculate scores. It contains all of the inputs needed to calculate OHI scores, and you will modify these inputs when conducting your assessment. By default it is named regionYEAR (e.g. cnc2016 for New Caledonia 2016) to indicate that the assessment is conducted at the region scale (province, state, district, etc.), based on input layers and goal models used in the most recent global assessment (e.g. 2016).
- `README.md` file accompanys most folders or files, as you will discover. It is a place to take notes for yourself, your team, and thinking ahead to anyone interested in the future.
Let's take a closer look at the `prep` and `region2016` folders.
## Prep folder
Click on `prep` and let's see what is inside:

Within `prep`, there is a sub-folder for each goal and subgoal, as well as pressures and resilience. These folders are meant to help you be organized and promote scripting for data preparation ([this is important for reproducibility and repeatability](https://www.nature.com/articles/s41559-017-0160)). Note that some goals depend on the same data and thus data can be prepared into layers from one place instead of for each goal. This is the case for goals dependent on habitat data: CP, CS, HAB, and goals dependent on species data: SPP, ICO.
Click on the 'CW' folder. Within each goal folder, there are typically a _.Rmd_ script and a sub-folder to contain data.
The `CW_data_prep.Rmd` document is a script where you will explore your raw data, format the data, try different models, make graphs and maps, as well as document decision making. We will come back to this script in Chapter \@ref(prep-data) to learn how to prepare data for calculations.
We use RMarkdown (.Rmd) files because they can be rendered as webpages (for example, `CW_data_prep.html` in the same CW folder) and can help explain the data processing steps and motivation behind them in written language. Click 'Knit' from the RStudio editor or click on the `.html` file from the file pane and select 'View in web browser', and you will see a clean, human-readable webpage that can be shared online and viewed by anyone.
_Now we've walked through the prep folder, let's take a look at the scenario folder. Click back to the main `toolbox-demo` folder, and open the `region2016` folder._
## Scenario folder (ex: `region2016`)

Again, this scenario folder contains all the data layers and scripts for you to calculate OHI scores. Let's look into the sub-folders and see what they do.
### layers folder & layers.csv
After you prepared your data layers in the `prep` folder, you will save them in the `layers` folder, and register them in `layers.csv`. (You will learn how to do so in Chapter \@ref(prep-data)).
The `layers` folder contains individual data layers as .csv files for each goal and subgoal, named in a specific manner for easy organization and recognition, as shown here.

`layers.csv` is a data registry for all the data layers in the layers folder. It is also a directory for `ohicore` to find the exact data layers for calculations. The file itself is spreadsheet that is best to be opened in a spreadsheet editor such as Microsoft Excel.

## conf folder
The `conf` folder includes important configuration files required to calculate OHI scores, as shown here. These are the model parameters that the Toolbox needs to calculate scores, along with your prepared data layers.

Most of the maneuvering in the Conduct phase of the assessment is done within this folder.
There are both .R scripts and .csv files. We will investigate them in the order you will interact with them.
### functions.R

**`functions.R` contains models to calculate goal status and trend for all goal and sub-goals**. Much of your time will be spent here developing goal models to calculate status and trend with the data layers you prepared.
Each goal and sub-goal equation is stored as a separate function within the script, identified by a 2- or 3- letter code. These functions calculate the status and trend using prepared layers saved in the `layers` folder and registered in layers.csv.
<!--- info about the rest of the conf files are modified from the manual --->
### scenario_data_years.csv
This file organizes year information for each layer. OHI assessments use the most recent data available, but which year is most recent will vary from data set to data set. `scenario_data_years.csv` acts like a registry to help keep track of all these years. When you calculate OHI scores, you will be explicit about the year your completed assessment will represent, and we call this the "scenario year".
This file also makes it possible for the Toolbox to calculate repeated assessments.
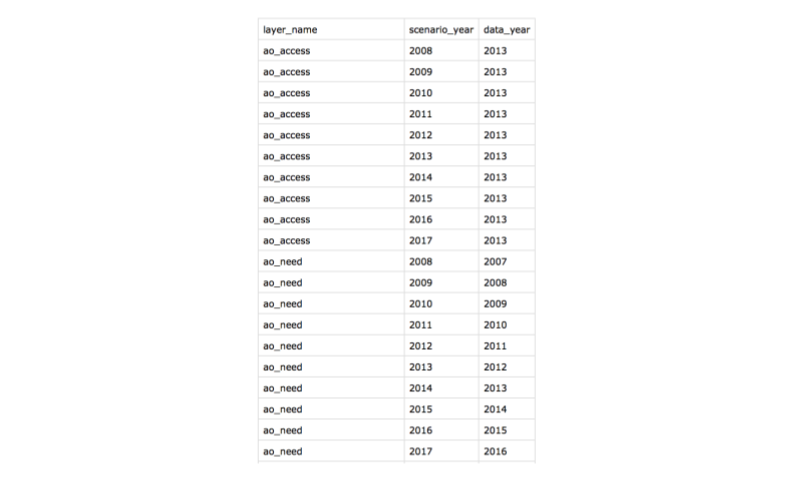
This file has 3 columns: the `layer_name`, the year your assessment represents, called the `scenario_year`, and the most recent year of data, called `data_year`.
Let's have a look:

You can see that for each layer, the `data_year` is associated with a `scenario_year`. In the example above, the data from the `ao_access` layer have never been updated so we use the same data year for each scenario year, which is therefore repeated in the `data_year` column. But for the `ao_need` layer, many years of data are available, but there is a lag time for which year of data corresponds to which scenario year.
### pressures & resilience
There are four .csv files relating to pressures and resilience.
- pressures_categories.csv
- pressures_matrix.csv
- pressures_categories.csv
- pressures_matrix.csv
They are spreadsheets that are best opened with Excel.

Pressures and Resilience are two of the four dimensions used to evaluate each goal or sub-goal, along with goal status and trend that you calculate in `functions.R`. More details on how to operate with these files are explained in future chapters.
**pressures_categories.csv**
This is a table to record the name of each pressures data layer, its category, and sub-category. Each data layer name is the same name that is saved in the layers folder and is registered in layers.csv. Each layer falls under one of two categories - ecological or social pressures, and one of several sub-categories to further represent the origin of the pressure (e.g. climate change, fishing, etc), which is also indicated by a prefix of each data layer name (for example: po_ for the pollution sub-category).
**pressures_matrix.csv**
This is a table that indicates which individual pressures (stressors) affect which goal, sub-goals, or components, and weights them from 1-3. A weight of 0 is shown as a blank. A higher weight indicates more negative impacts on that goal or component of the goal. These weights are relative to each row of the matrix (goal, sub-goal, or component). These weights are used in global assessments based on scientific literature and expert opinion, and you can modify the weightings if necessary for your assessment. The pressures matrix is the same as Table S25 in Halpern et al. 2012, with current and detailed information in the online [OHI-Global supplemental information](https://rawgit.com/OHI-Science/ohi-global/draft/global_supplement/Supplement.html#432_pressure) document.
Each pressure (column) of the pressures matrix is the layer name of the pressures layer file that is saved in the layers folder and is registered in layers.csv, matching what’s recorded in the pressures_categories.csv.
**resilience_categories.csv**
Similar to pressures_categories.csv, this file contains information on each resilience data layer, including its name, category, and sub-category. Each resilience layer’s name is the same as the data layer to be saved in the layers folder and is registered in layers.csv. In addition, it also includes information on category type - ecosystem, regulatory, or social, indicating the origin of the resilience layer.
Each resilience layer is also assigned a weight of 0-1, representing the level of resilience against pressures. Different from the values used in pressures matrix, the resilience weights depend on the level of information available.
**resilience_matrix.csv**
This is a table that indicates which individual resilience measures affect which goal, sub-goals, or components. The resilience matrix is the same as Table S26 from Halpern et al. 2012, with current and detailed information in the online [OHI-Global supplemental information](https://rawgit.com/OHI-Science/ohi-global/draft/global_supplement/Supplement.html#433_resilience) document.
### goals.csv
`goals.csv` is another spreadsheet file that is best opened in Excel.

`goals.csv` has information about goals and sub-goals, and controls which goals are calculated, and how they are represented in figures. If a goal exists in this list, it will be calculated, and needs an accompanying function in `functions.r`. **You will likely only modify this file if you are removing or adding goals or sub-goals, or changing the weighting for how goals are combined**.
Here are the columns within `goals.csv`:
- order_color & order_hierarchy: the order to display in flower plots
- order_calculate: the order in which the goals and sub-goals are calculated for the overall Index scores
- goal & parent: indicates the relationship between sub-goals and supra-goals (i.e. goals - with sub-goals)
- weight: the relative weight of each goal to calculate overall Index scores
- preindex_function: indicate what parameters are called to calculate scores for goals and - sub-goals in functions.R
- postindex_function: indicate what parameters are called to calculate scores for supra-goals in functions.R
### config.R

`config.R` configures labeling and constants appropriately. You will only need to modify this file when working with goals that have categories (example: habitat types or economy sectors) that are affected differently by pressures and resilience measures.
### conf folder recap
We have just explored the files in the `conf` folder. To recap, the `conf` folder contains important configuration files required to calculate OHI scores, including functions.R, scenario_data_years.csv, and pressures and resilience files. Now let's take a step back to the `region2016` folder, and check out what else is there.
## calculate_scores.Rmd
*Note: `calculate_scores.Rmd` replaces three files that existed in previous versions of the Toolbox: `calculate_scores.R`, `configure_toolbox.R`, and `install_ohicore.R`. We collapsed those three files into one .Rmd file to simplify the workflow, although they still function correctly as individuals if your repository has them as three separate files. You can find information about these three files below.*

`calculate_scores.Rmd` is the code and workflow to calculate OHI scores. It enables the information in your repository to interact with an `R` package called `ohicore`, which does the core operations to calculate OHI scores. This Rmd will install the `ohicore` package at the beginning of your assessment, and then call it as a library after that.
Whenever you change any data in `layers`, modify models in `functions.R`, and make changes to pressures and resilience, you could run code from this file and see how the OHI scores change. Scores will be saved in scores.csv.
### calculate_scores.R
*Note: depreciated, see calculate_scores.Rmd section above. This script used to be inside the repository's scenario folder.*
`calculate_scores.R` is a script you'll come to use often. As the name tells us, it is a script to calculate OHI scores. Whenever you change any data in`layers`, modify models in `functions.R`, and make changes to pressures and resilience, you could run this script and see how the OHI scores change.
This script runs everything required to calculate OHI scores using the prepared layers the layers folder that are registered in layers.csv. Scores will be saved in scores.csv.
### configure_toolbox.R
*Note: depreciated, see calculate_scores.Rmd section above. This script used to be inside the repository's scenario folder.*

This script does the pre-checks before running goal models and calculate scores. It loads `ohicore`, calls all goal functions and data layers in the “conf” folder, and check that all data layers are registered properly. You are encouraged to use this script when you’re working on individual goal models. After you register data layers for a goal, or make any changes to the data layers, source this script before running model-specific functions in functions.R.
### install_ohicore.R
*Note: depreciated, see calculate_scores.Rmd section above. This script used to be inside the repository's home folder.*
`ohicore` is the backbone software package of the Toolbox. It is a `R` package of functions that contain all the core operations for the data and models that you provide for your assessment, and it will calculate OHI scores. You don't need to interact with or see the inside of `ohicore` yourself during the assessment, but you do need to install this software package once at the start of your assessment by running this script.
### Recap
The OHI Toolbox is a ecosystem of data layers and scripts, contained in folders and their sub-folders.
The information in your repository will interact with an `R` package called `ohicore`, which does the core operations to calculate OHI scores. You will need to install this package at the beginning of your assessment, and then call it as a library after that.
As you begin your assessment, you will spend most of your time in `prep` folder, where you upload, explore, and format your data layers to be saved in the scenario folder `region2016` for the next step of calculations.
`region2016` is a folder with all the data layers, files, and scripts you'll need to calculate scores. There you will register finished data layers, modify goal models, modify pressures and resilience, calculate OHI scores, and make flowerplots.
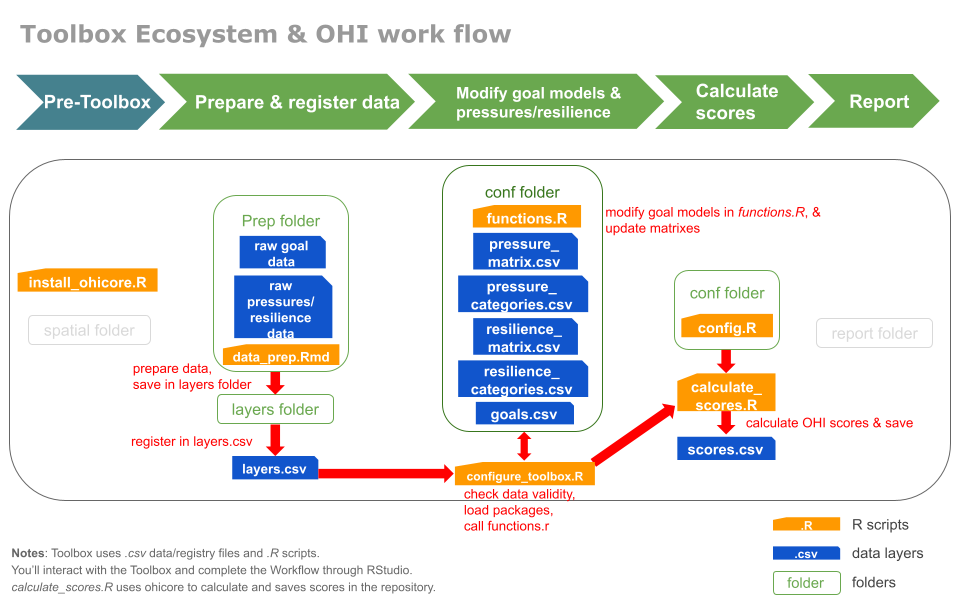
Now we have walked thorugh the files, how do they fit into the OHI process? Below is a figure that summarizes how each file will be used in relation to the steps you would take in an assessment for future reference.
