ELK (Elasticsearch-Logstash-Kibana) and Graphite/Grafana are the most popular tools for analyzing your logs and metrics. Almost every company has one of these tools running, with various use cases like big data, analytics or just monitoring. In this hands-on workshop the student learns the fundamental skills needed to understand the concepts en start creating their Monitoring configuration. Main topics that are covered are setting up your logstash configuration for log parsing, enabling metric gathering with Graphite (i.e. Collectd) and finally create some awesome dashboards. The hands-on workshop is fully scenario based, including helpful lab exercises, sample code and a prepared Vagrant Box running on Linux. To run the Vagrant Box in Virtual Box a minimum of 2 GB memory or better is preferred."
Arnold van Wijnbergen is an independent advisor, coach and consultant from Devoteam. He specializes in Monitoring and Automation topics to improve quality and efficiency of operational control of IT4IT business. To achieve this he combines Lean principles with DevOps culture, because he strongly believes in the power of culture and self-steering teams. His broad experience in Monitoring and Automation tooling implementations ranges from MKB till enterprise scale, formed mainly in the banking, insurance, governance, retail, telco and service provider branches. At ING he is management consultant within the ING Automate monitoring stream, which is responsible for advising, training and coaching DevOps teams with improving their monitoring capabilities.
We welcome you to the workshop that will learn you to setup your own IT Operations data lake. All this can be achieved by using popular open source tools and technologies.
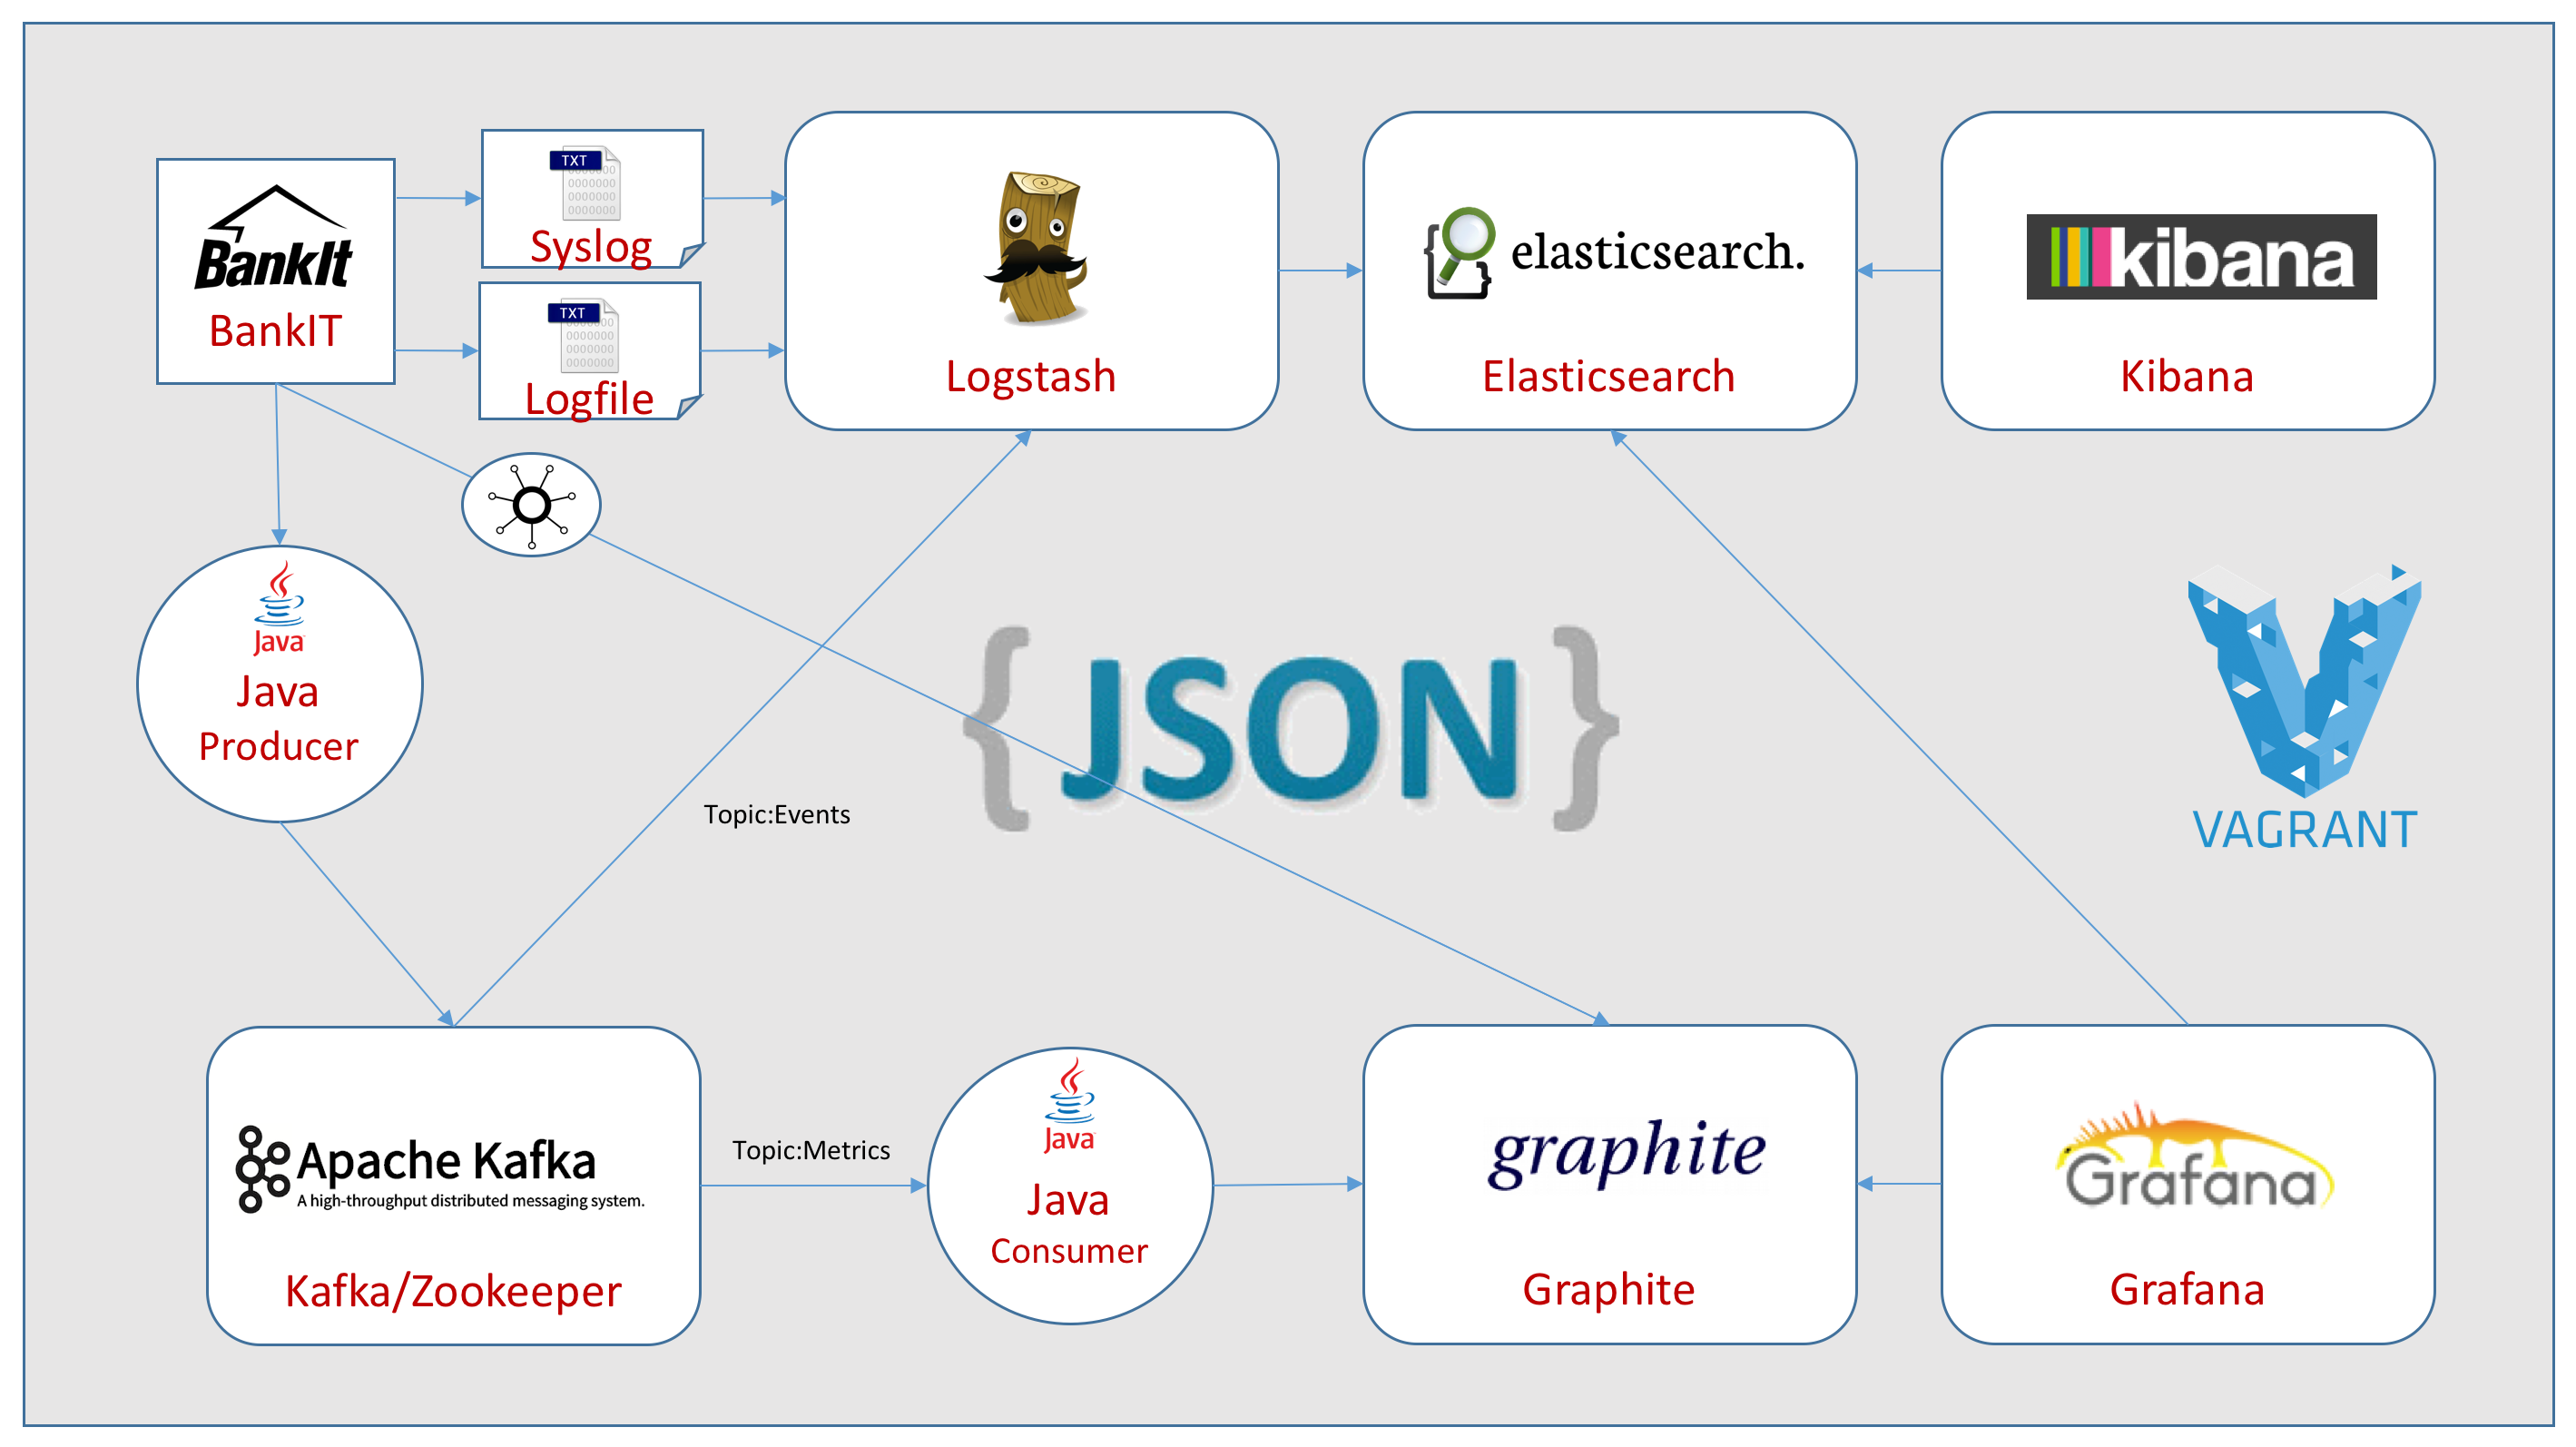
Participants in the training will go through the steps involved in installing and developing a simple ITOps data lake from a Vagrant box using ELK, Graphite and Kafka. Below an overview:
- BankIT, the fictive application that is submitting the monitoring data.
- Logfile, which stores the application server logs.
- CollectD, which directly sends OperatingSystem metrics to the Graphite environment.
- Logstash indexer, which transforms your input streams to their associated output.
- Elasticsearch document store, which is the distributed system which will store all events in JSON format and has Lucene capabilities for full text searches.
- Kibana dashboard, which gives visualization access to the elasticsearch document store.
- Java Producer, which is the simulation worker for generating events and metrics to the eponymous topics.
- Kafka/Zookeeper, which is a high throughput distributed message broker for real-time integration.
- Java Consumer, which is the worker for retrieving the metrics from the topic and sending them to Graphite.
- Graphite, which is a Python/Django/Whisper based application for storing numeric time-series data and rendering their graphs.
- Grafana, which is a dashboard application for displaying metric data from various sources like Graphite and Elasticsearch.
This will be a self-paced beginners’ tutorial for attendees to learn ELK, Kafka and Graphite basics as they install and develop this ITOps data lake within their Vagrantbox. Experienced Devoteam colleagues will serve as support to help attendees successfully complete this workshop.
At the workshop, you will need to bring your own computer. Before you go to the DevOpsDays 2016 workshop, there are some steps you should do some preparation to get your work environment ready. Here are the steps:
- For PC, Mac and Linux users we need you to install the latest version of Vagrant and VirtualBox.
- If you are new to Vagrant execute the Getting Started for a very simple introduction. Skip this step if you are already familiar with Vagrant.
vagrant init hashicorp/precise64
vagrant up
vagrant ssh
hostname
uname –a
exit
vagrant destroy

