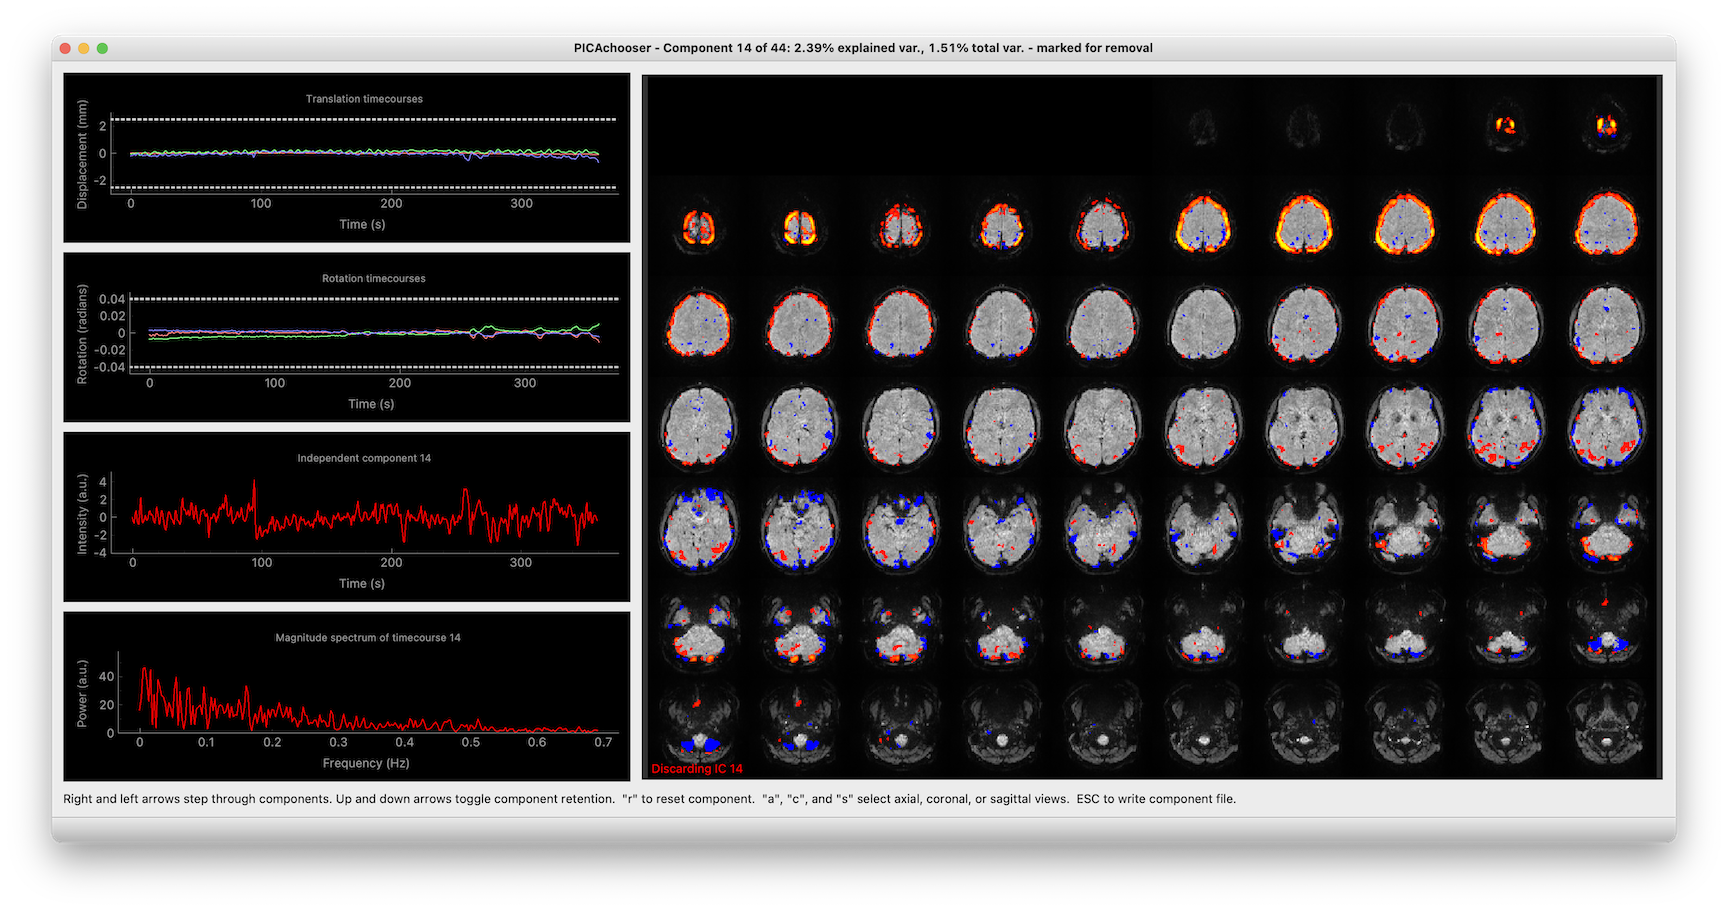
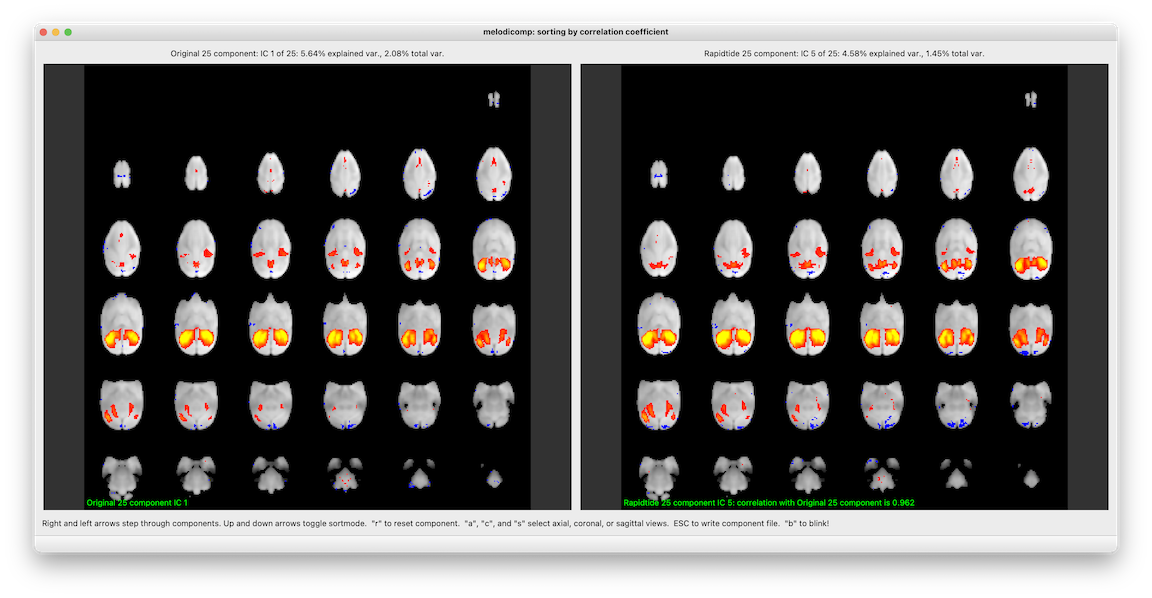
A set of simple gui tools for scanning through MELODIC probabalistic ICA runs and quickly making decisions about which components to retain, and what relates to what. These tools each only do one thing, but they do them quickly and easily using only keyboard input. Current programs are PICAchooser, melodicomp, and grader.
Full documentation is here: https://picachooser.readthedocs.io/en/latest/introduction.html
Lets you step through the components in an ICA analysis (from many sources), and select which components you want to retain. In addition to showing the spatial ICs, it also displays the componnent timecourses, motion traces, and the correlation between them, to help with your decision making.
Once you launch, you do everything with keyboard commands, and it's been optimized to go as fast as possible, so you aren't waiting around for things.
Puts up two melodic IC files side by side. In order to make the comparison meaningful, it first calculates the spatial crosscorrelation between each IC in the first file and each IC in the second. As you step through components in the first file, on the right you see the component with the highest crosscorrelation in the second file. You can sort either by IC order in the first file (i.e. in order of descending variance explained), or in descending correlation coefficient (i.e. best matched components first). When you quit (or hit the escape key), it writes out a file listing the best matched ICs along with their correlation coefficients.
I'm especially proud of the "blink" feature. When you hit the "b" key, the right and left window swap, instantaneously. This lets you see what changes between the two sets of networks in a very natural way. This is inspired by blink comparators, a cool old piece of tech probably long forgotten by most.
Again, once you launch, you do everything with keyboard commands, and it's been optimized to go as fast as possible, so you aren't waiting around for things.
Astute users will notice that components are numbered differently in different contexts. This is actually intentional. In the GUI, and in any files that work directly with FSL tools, I use whatever convention FSL uses. So for displayed components, the first component is IC1. Output files that will be used by fsl_regfilt also use this convention. However, for any informational output on the terminal that you might use when looking at components in FSLeyes directly, or operating on them with fslmaths or your own python code, the component numbering starts at 0. As the universe intended. If you use matlab, add 1 in your head.
This code base is being developed and supported by a grant from the US NIH 1R01 NS097512.
PICAchooser would not be possible without many additional open source packages. These include:
- Luke Campagnola. PyQtGraph: Scientific Graphics and GUI Library for Python
- Nibabel: Python package to access a cacophony of neuro-imaging file formats | https://10.5281/zenodo.591597
- Stéfan van der Walt, S. Chris Colbert and Gaël Varoquaux. The NumPy Array: A Structure for Efficient Numerical Computation, Computing in Science & Engineering, 13, 22-30 (2011) | https:10.1109/MCSE.2011.37
- Pauli Virtanen, Ralf Gommers, Travis E. Oliphant, Matt Haberland, Tyler Reddy, David Cournapeau, Evgeni Burovski, Pearu Peterson, Warren Weckesser, Jonathan Bright, Stéfan J. van der Walt, Matthew Brett, Joshua Wilson, K. Jarrod Millman, Nikolay Mayorov, Andrew R. J. Nelson, Eric Jones, Robert Kern, Eric Larson, CJ Carey, İlhan Polat, Yu Feng, Eric W. Moore, Jake VanderPlas, Denis Laxalde, Josef Perktold, Robert Cimrman, Ian Henriksen, E.A. Quintero, Charles R Harris, Anne M. Archibald, Antônio H. Ribeiro, Fabian Pedregosa, Paul van Mulbregt, and SciPy 1.0 Contributors. (2020) SciPy 1.0: Fundamental Algorithms for Scientific Computing in Python. Nature Methods, 17, 261–272 (2020) | https://doi.org/10.1038/s41592-019-0686-2
- McKinney, W., pandas: a foundational Python library for data analysis and statistics. Python for High Performance and Scientific Computing, 2011. 14.


