Robert Turner, "Image Processing with Python" maintainers
August, 2022
<style> .reveal h1 { font-size: 2em; } .reveal h2 { font-size: 1.5em; } </style> <script> Reveal.initialize({ slideNumber: true }); </script>Thanks to CarpentryCon 2022 for having this session, thank you for coming.
- Robert "Bob" Turner
- Toby Hodges
- David Palmquist
- Special thanks to Prof. Mark Meysenburg, Prof. Tessa Durham Brooks, Dr. Raychelle Burks, and everyone involved in the initial design and testing of the curriculum within the DIVAS Project.
- Dominik Kutra and Dr. Constantin Pape made an essential contribution by converting the lesson to use scikit-learn.
- Dominik Kutra and Dr. Gregor Mönke taught the alpha pilot at EMBL, with help from Dr. Christian Tischer and support from the EMBL Bio-IT Project.
- Trisha Adamus and Prof. Mark Meysenburg taught the alpha pilot at the University of Arizona, with help from Zuzana Adams, Amirhossein Azami, Ryan Carlson, Courtney Comrie, Gabriela De La Cruz Sanchez, Chris Klimowski, Shuailong Li, Chuan Luo, Artin Majdi, Maliaca Oxnam, Travis Struck. That workshop was hosted by the BIO5 Initiative, in partnership with CyVerse, the D7 Data Science Institute and the UArizona Libraries
- Dr. Kimberly Meechan, David Palmquist, Prof. Ulf Schiller, and Dr. Robert Turner have taken over as Maintainers and core contributors for the lesson, and continue to drive its development.
- Many community members have opened issues and pull requests to improve the lesson.
- The lesson development process was supported by Dr. Erin Becker and Dr. Toby Hodges from The Carpentries Curriculum Team.
Pre-alpha-->Alpha-->Beta-->Stable
- Exercise caution
- Feedback welcome
- Second beta pilot needed (please get in touch)
- Images are everywhere.
- Images data is different to data frame data.
- Introduction to images in research.
- How images are represented by computers.
- Software tools for working with images.
- Manipulating images using software.
- Extracting data / statistics from images.
- Pixels
- Arrays
- Coordinates
- Channels
- Kernels
- Binary masks
- AI / Deep Learning
Lesson is a more "traditional" approach: easier to explain results, less data-intensive.
- Bash shell skills
- Navigating directories using
pwd,ls,cd <subdirectory>, andcd .., Run a Python script from the command line.
- Navigating directories using
- Python skills
- Variables and types, lists, logic (
if,else, etc.), basic file input / output
- Variables and types, lists, logic (
- Data
- Download from FigShare
- Software
- Anaconda (base environment includes all required packages) and Jupyter Notebooks
- What research questions can we answer with image processing?
- Morphometrics
- What research area are you most comfortable in?
- What research areas do you expect your learners to come from?
- Are there any particular challenges in working with image data in these areas?
- Representation of images in computers.
- Images, arrays and pixels.
- How RGB is used to make colour images.
- File formats and compression.
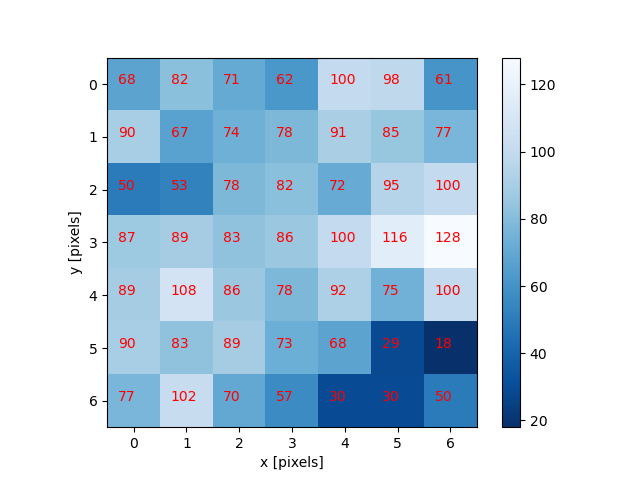
Image with pixel values overlaid
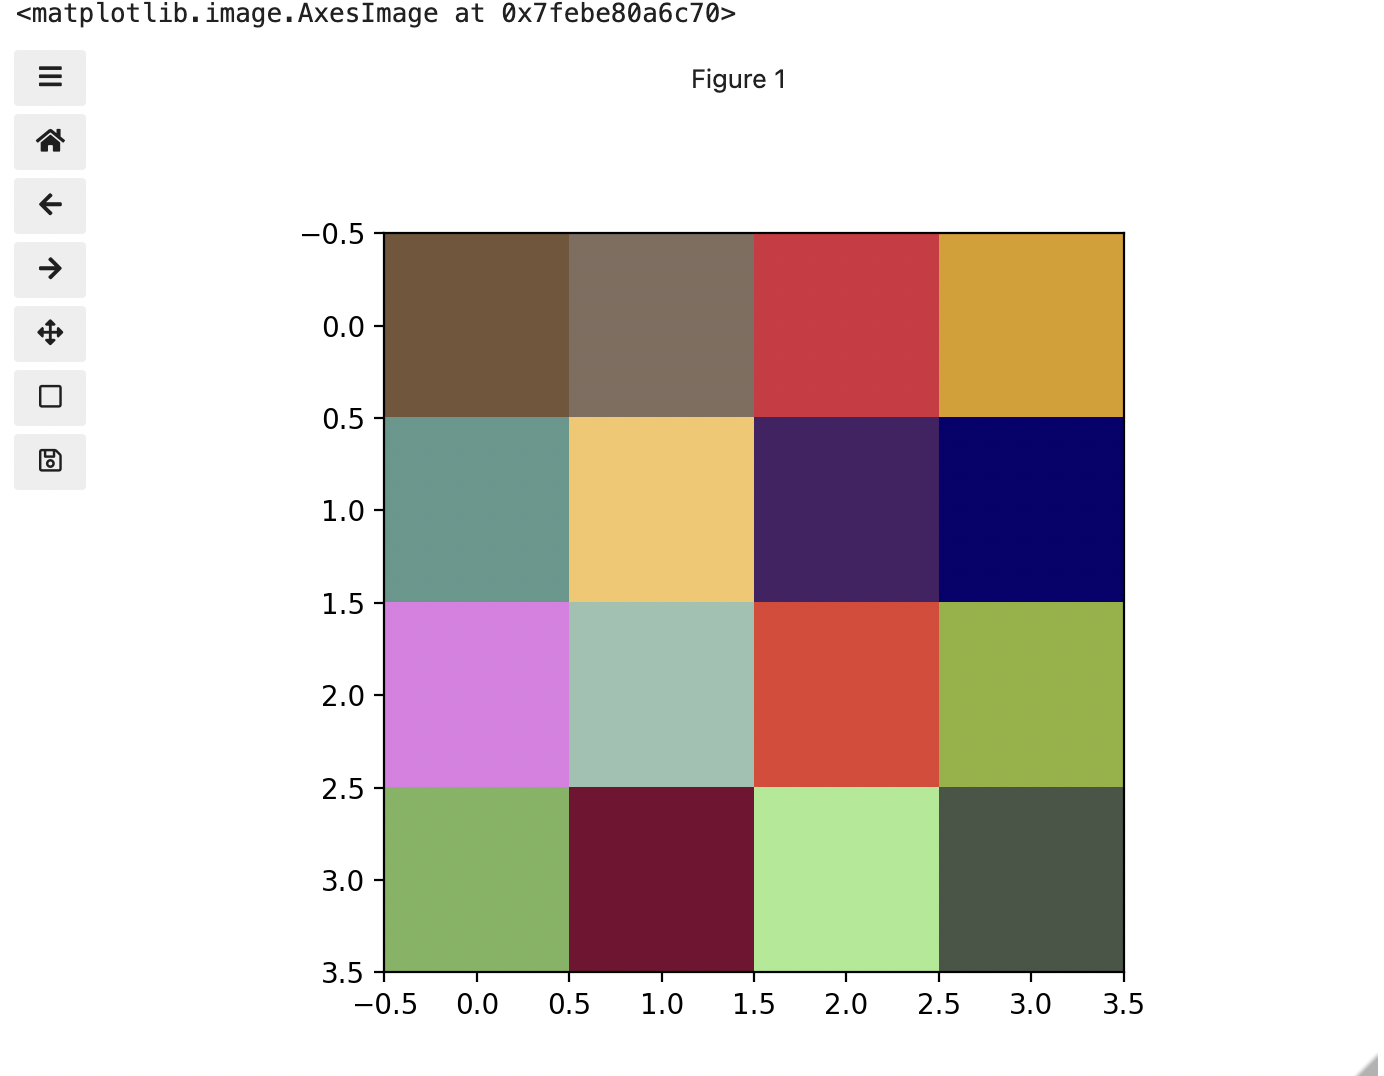 RGB Image |
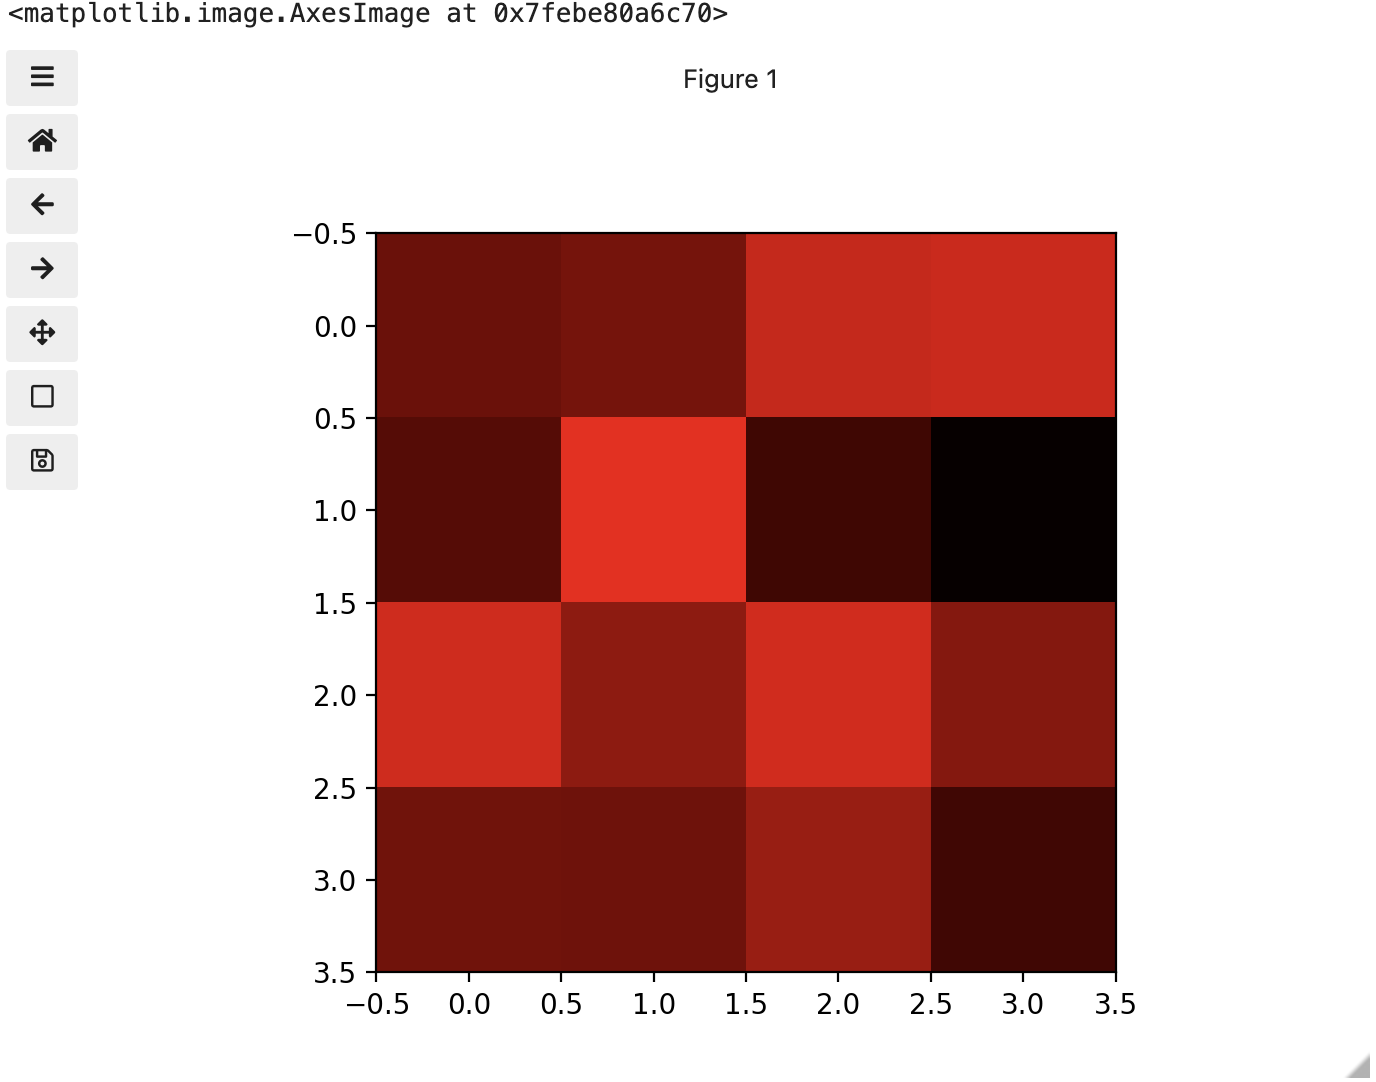 Red channel |
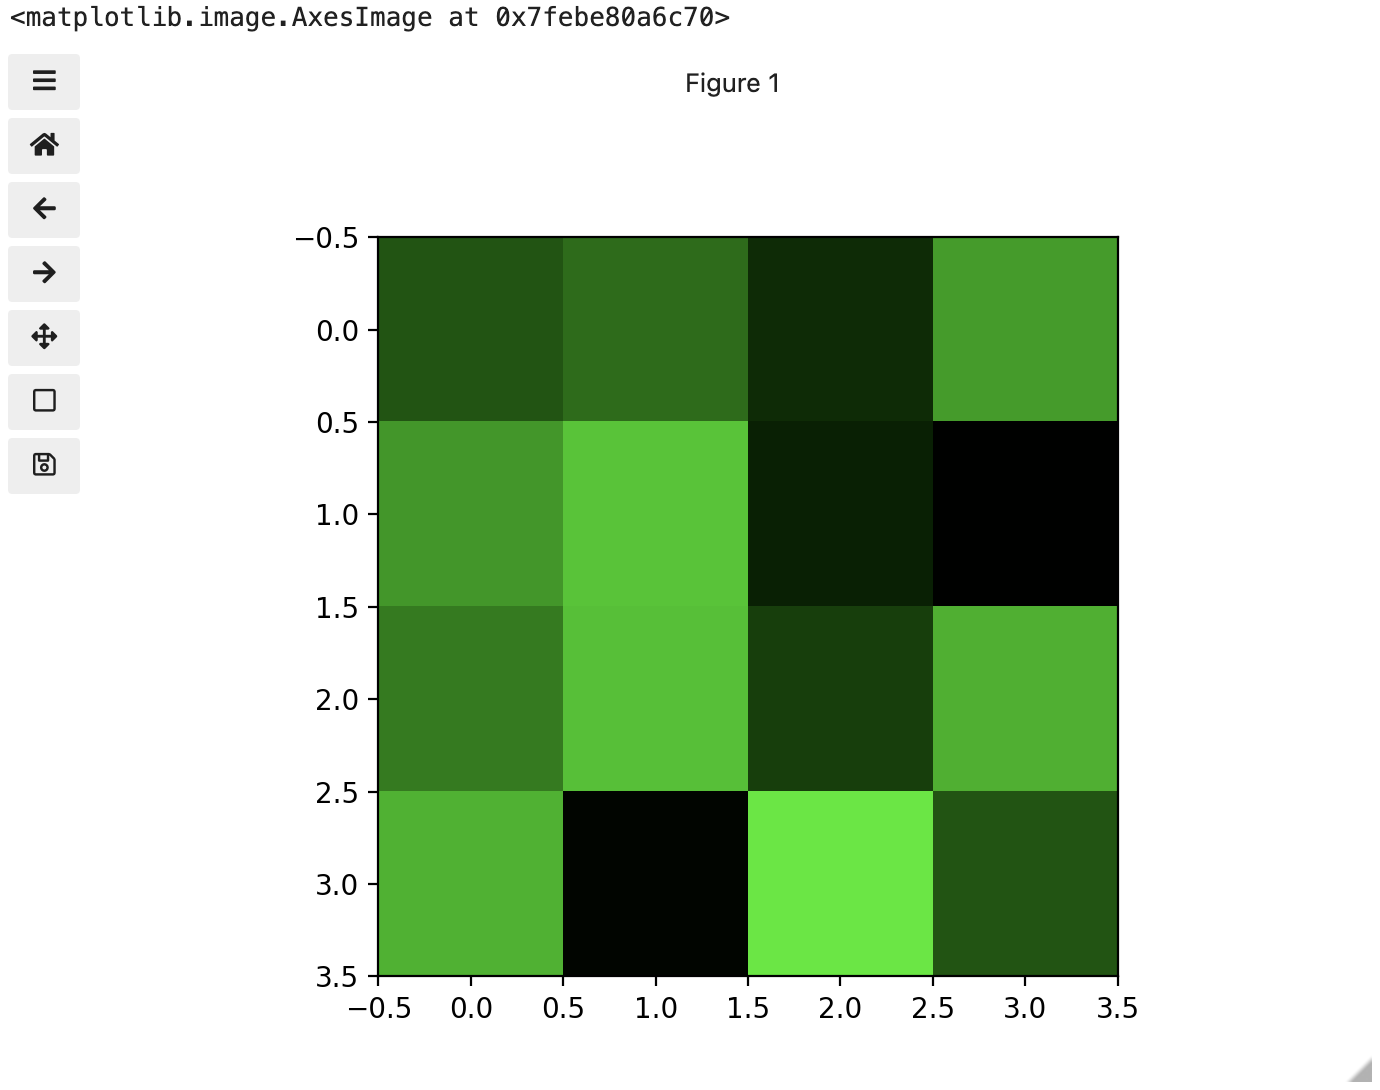 Green channel |
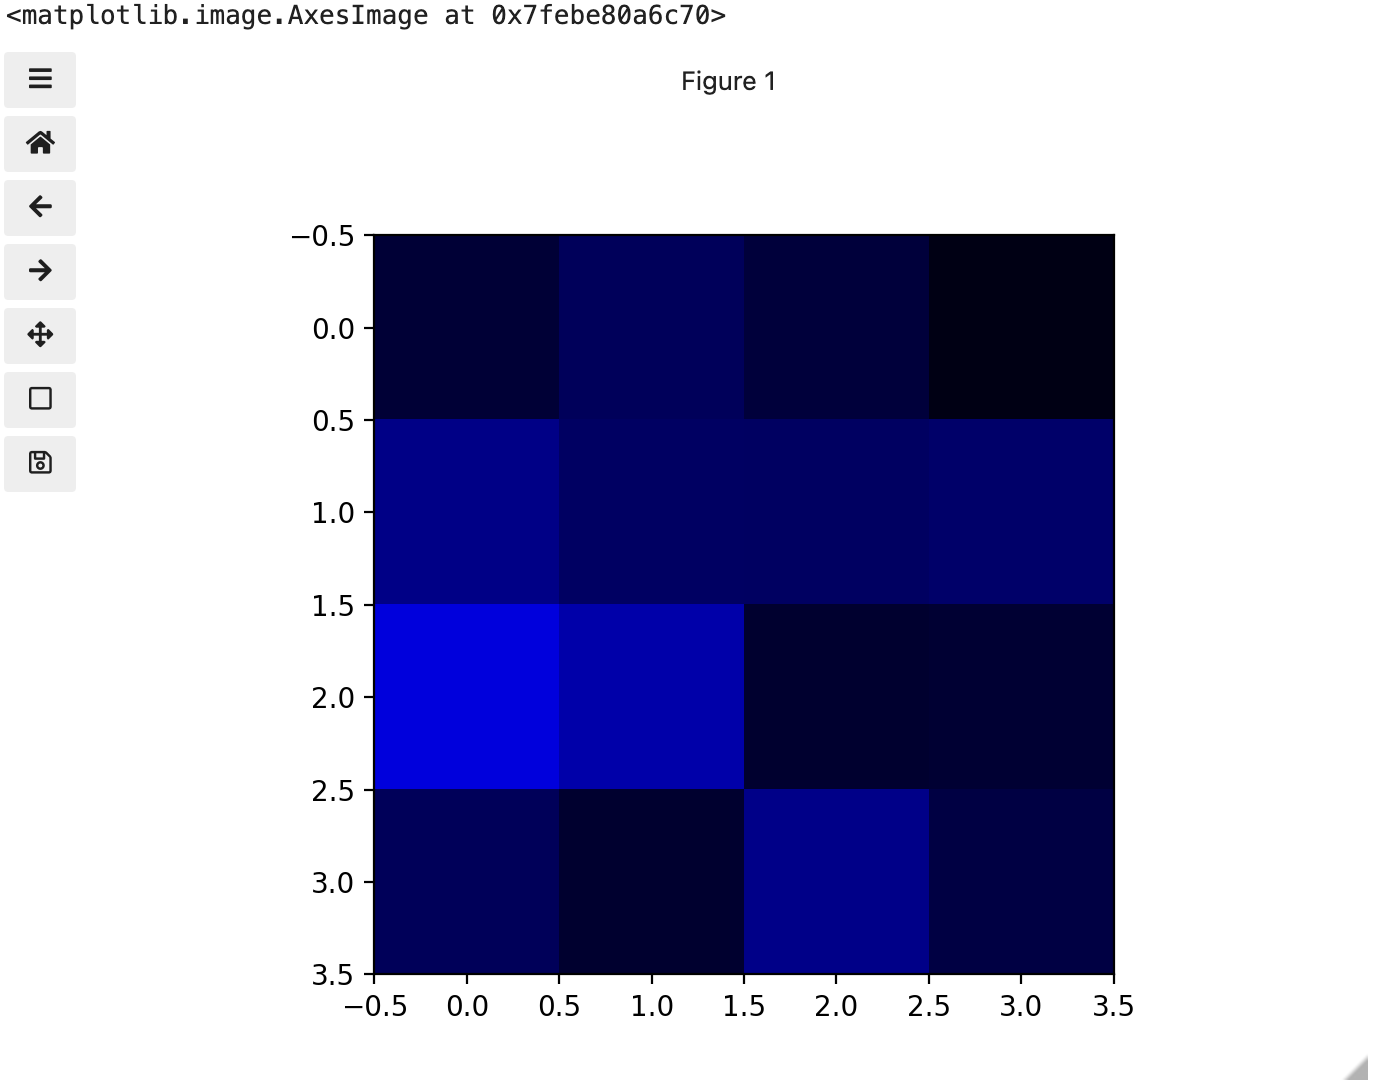 Blue channel |
skimage(Scikit Image)- Input + Output (images are not stored in
numpyfriendly formats) - Do weird things with arrays (e.g.
skimage.transform.resize)
- Input + Output (images are not stored in
numpy- Conventional array stuff (e.g. sub-setting, find all values
> x)
- Conventional array stuff (e.g. sub-setting, find all values
- Creating images from nothing
- Masking (setting pixels to be ignored)
- The distribution of intensity of colour in an image can tell us things.
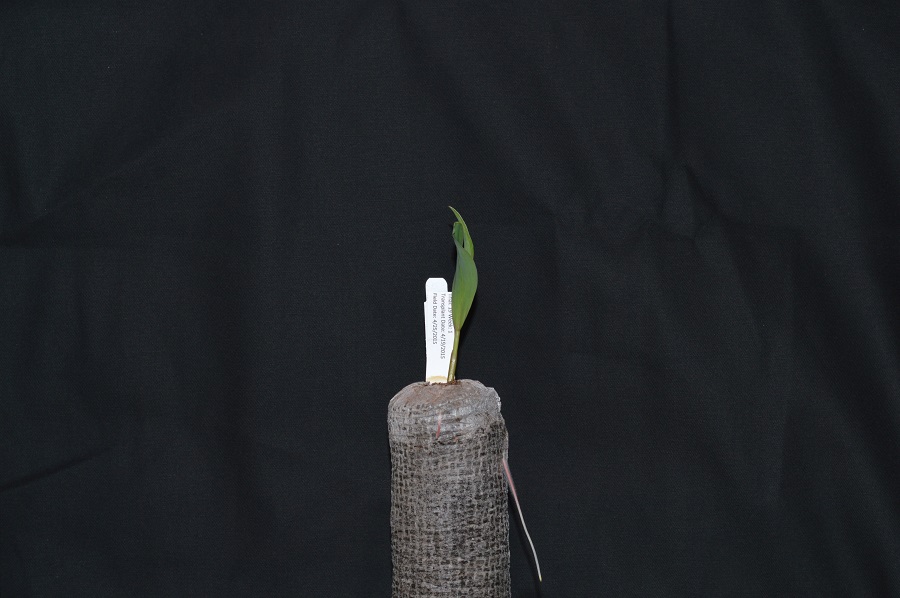 Plant Seedling |
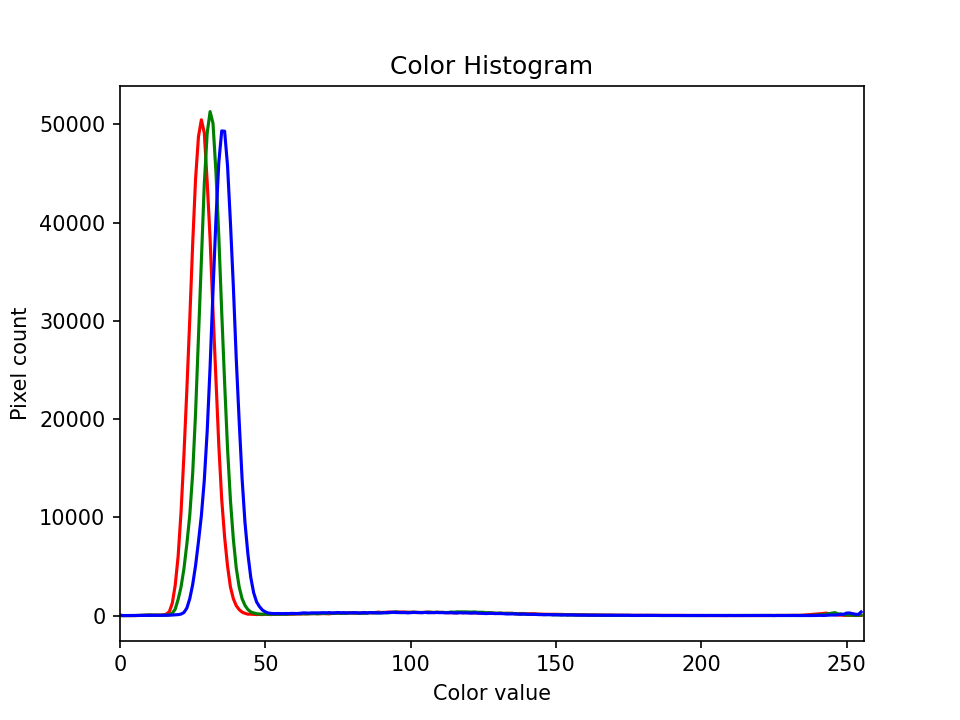 Histogram |
- Why blur?
- What's the relationship between blurring, filtering, convolution and kernels?
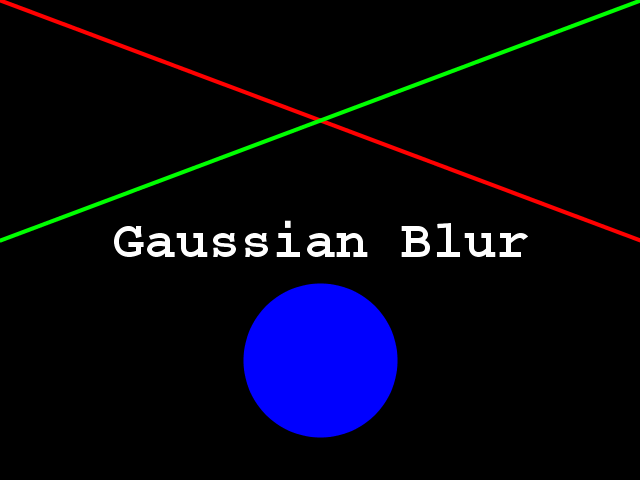 Not Blurred |
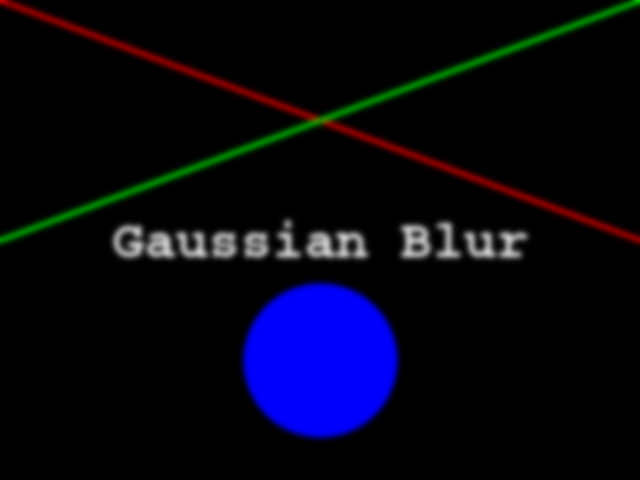 Blurred |
- What is thresholding?
- Why would we want to do it?
- What methods are available?
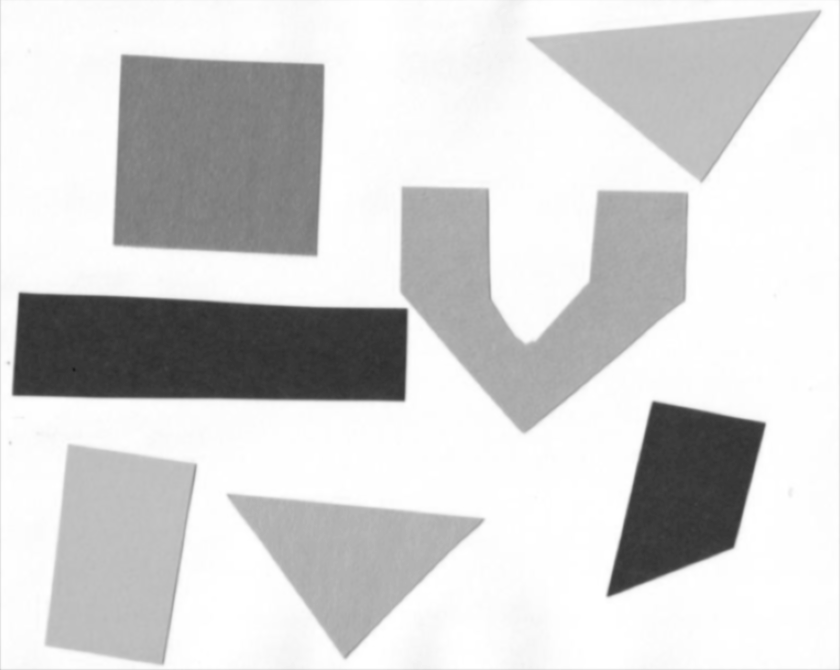 Blurred Grayscale |
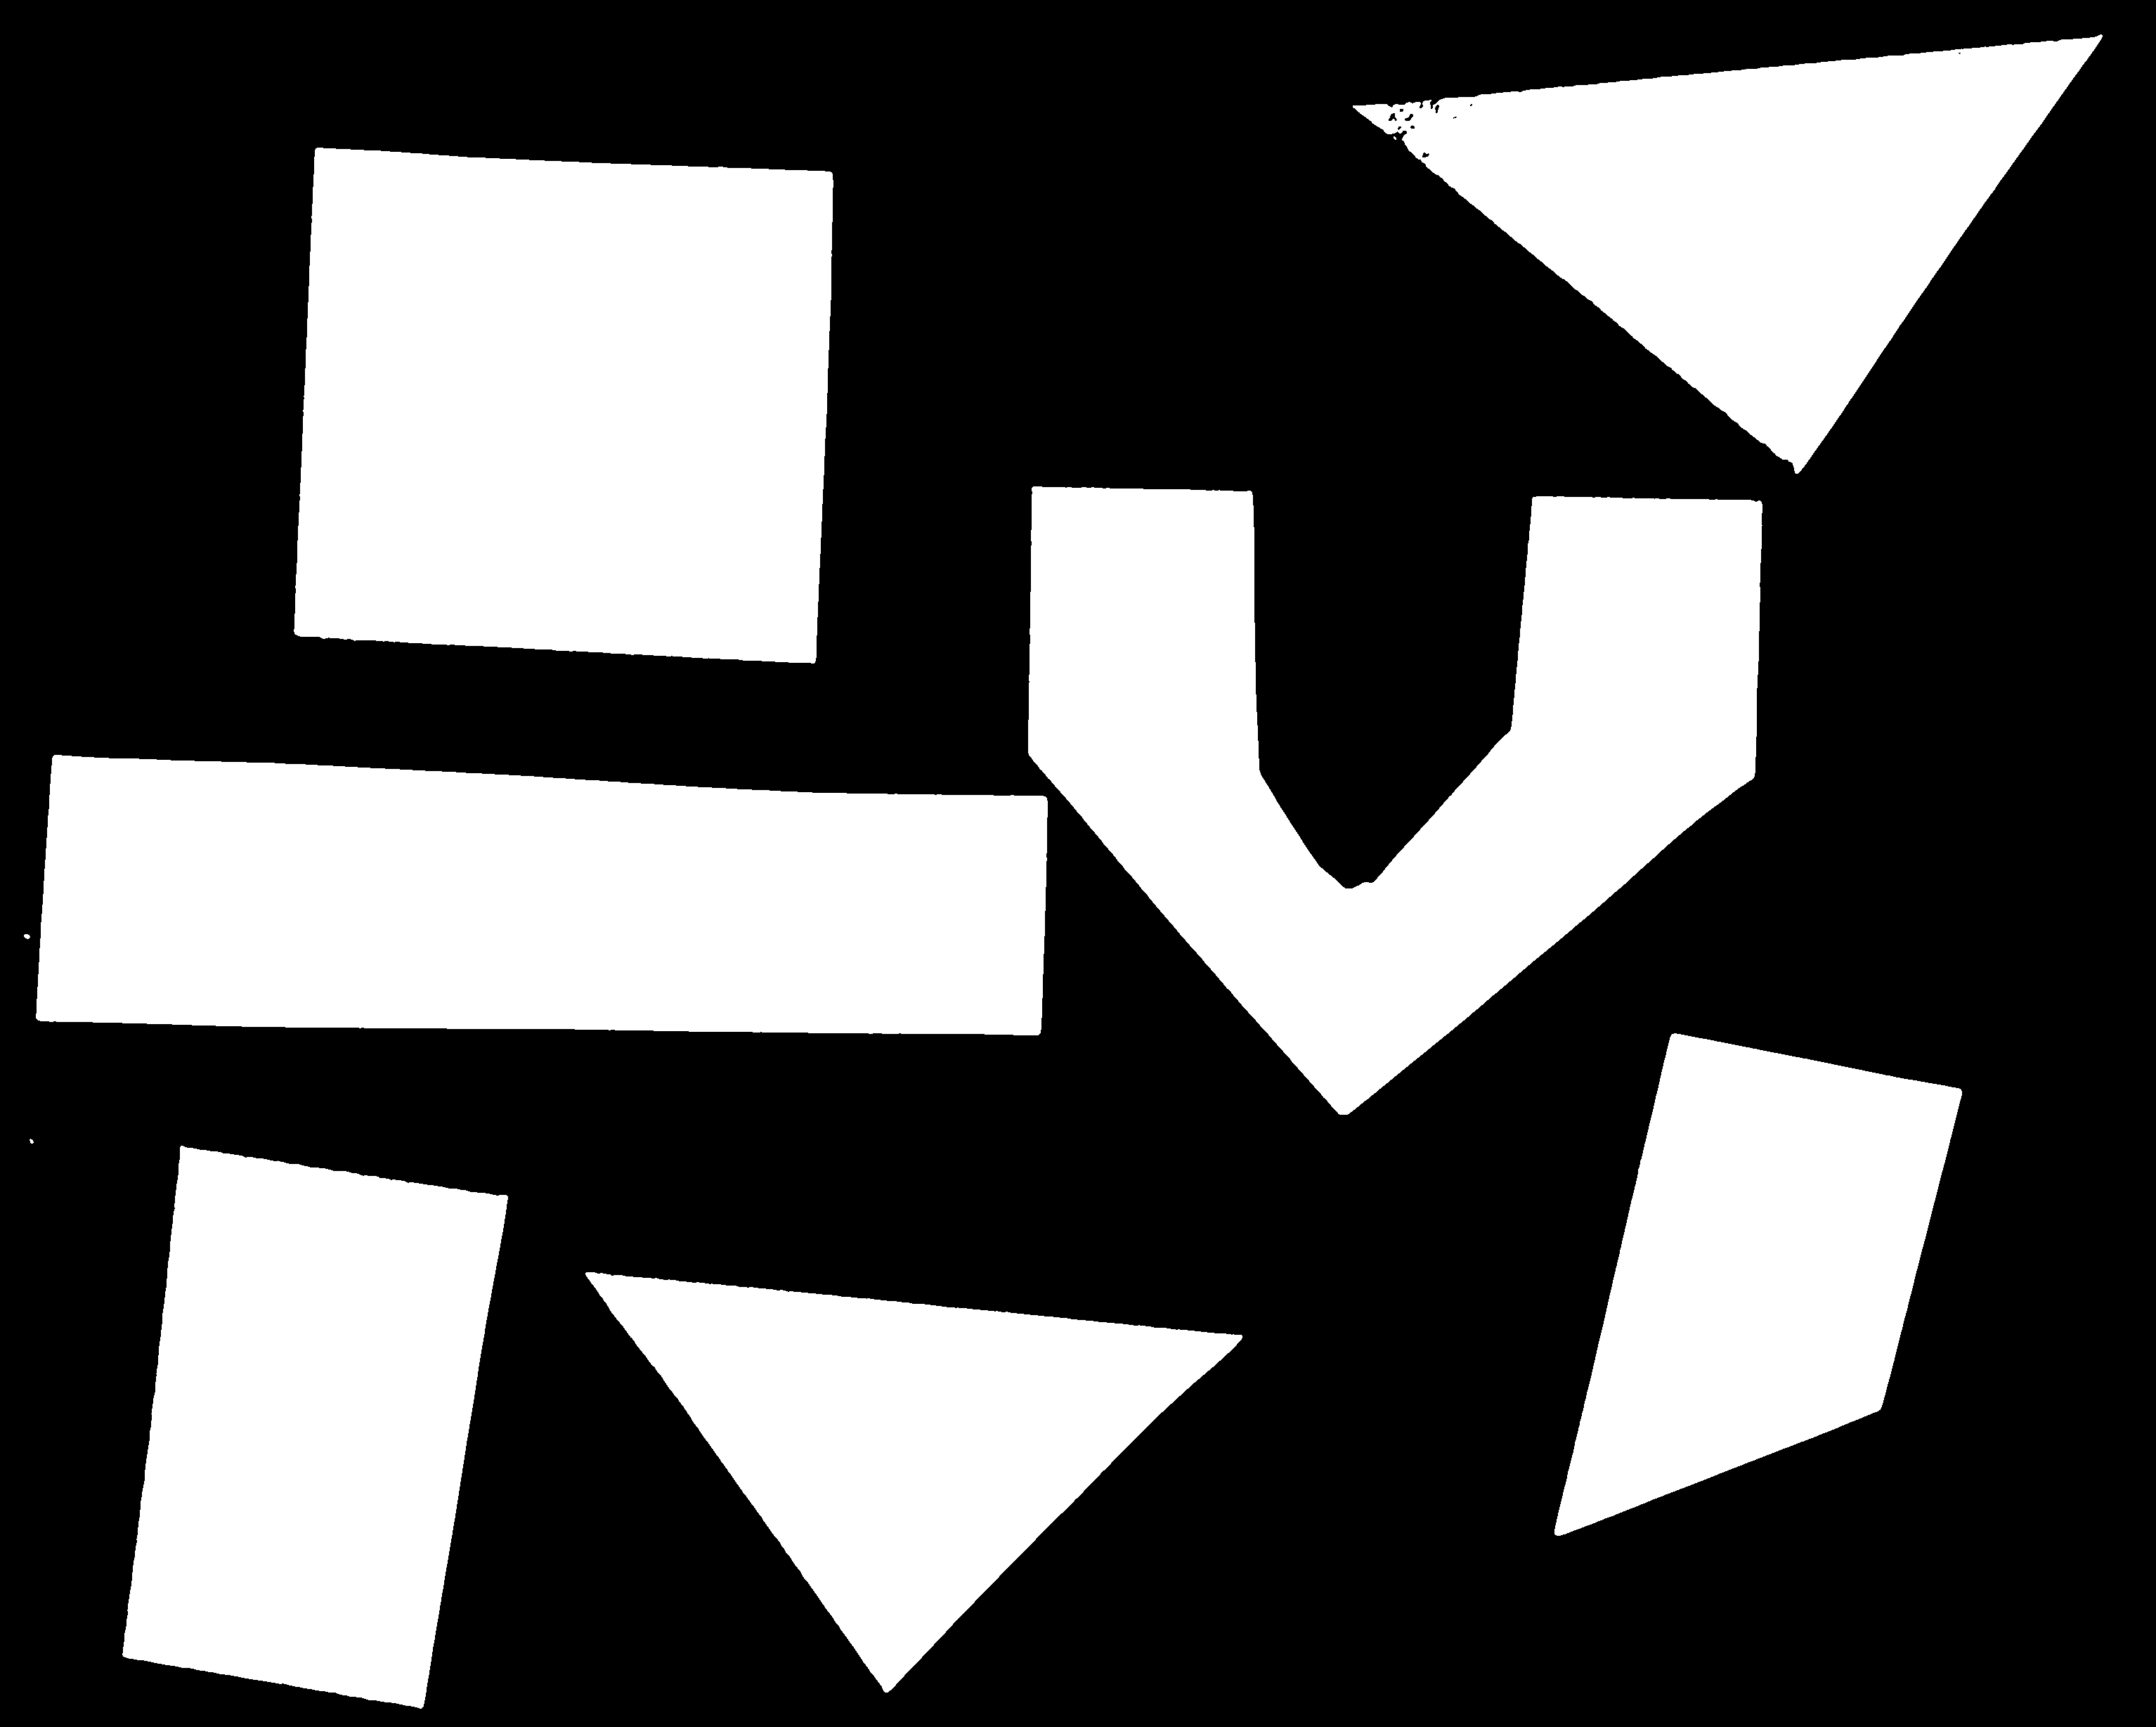 Threshold Applied |
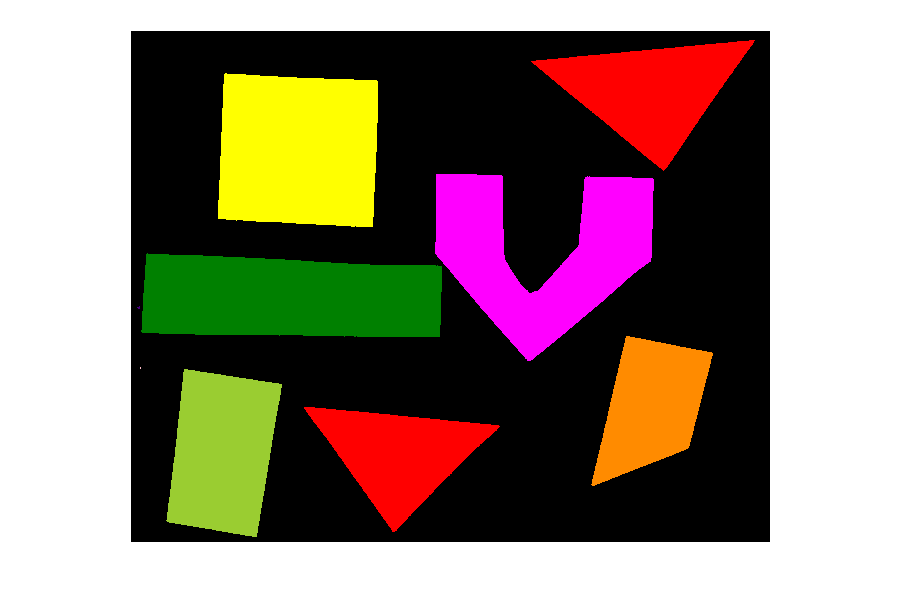
- Separating objects and getting information about them.
Labelled Shapes
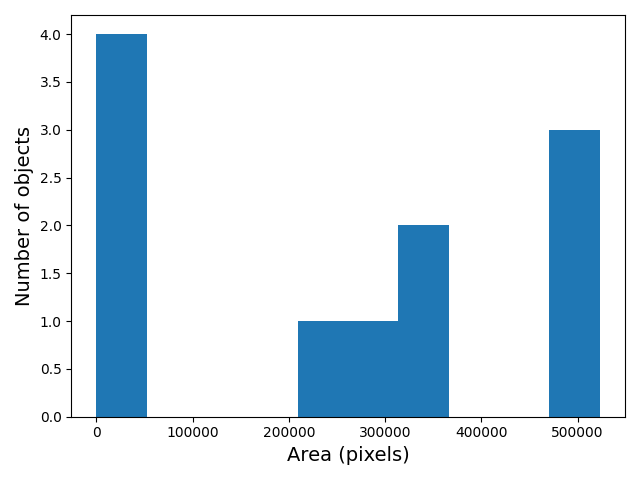 Areas Histogram |
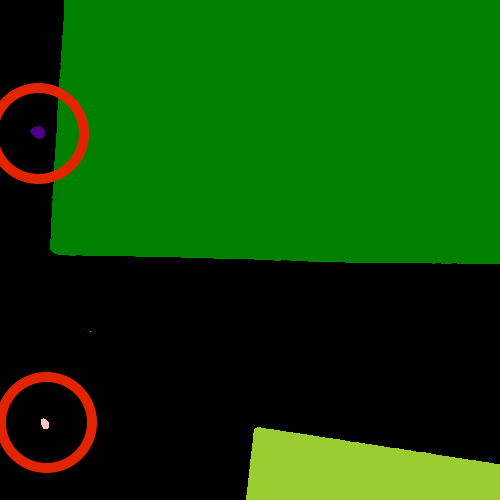 False Positive Objects |
- Properties of the shape of an object.
- skimage regionprops
- Basic e.g. area, perimeter, center
- More complex e.g. eccentricity, bounding box
- Brings together blurring, thresholding and connected component analysis.
- Example used is counting colonies of bacteria.
- What questions would you expect to be asked by learners?
- How would you answer them?
