-
Notifications
You must be signed in to change notification settings - Fork 106
New issue
Have a question about this project? Sign up for a free GitHub account to open an issue and contact its maintainers and the community.
By clicking “Sign up for GitHub”, you agree to our terms of service and privacy statement. We’ll occasionally send you account related emails.
Already on GitHub? Sign in to your account
High PLC CPU utilization and large number of connection errors. #77
Comments
|
Can you post your NodeJS code? |
|
Thanks so much for your reply. Here's my code: |
|
A few other things: Is the 1769 local to the NodeJS servers? I also see the the test processor is a 1769 while the production processor is going through a 1756-ENBT. I believe that the 1769 supports fewer packets per second than the 1756-ENBT. Also, the 1769 CPU is going to be showing the load for everything the processor is doing...there’s only one processor. The 1756-ENBT is only handling comms and nothing else. |
|
I would try adding the tags to a tag group, running one read for the tag group, and time how long the read takes. |
|
I tried the following with a polled tag group. It seems to take about the same time (possibly a couple seconds longer). |
|
I don’t think I have anything with that many tags running. I have things with maybe 100 or 150 tags at a 50 to 100 ms update rate for displays. I have some larger structures that run at around 1000ms. I think they total around 5k of data. But they’re read as structures, which is much much faster than individual tags for the same amount of data. If I get some time, I can try and setup a test to see what I get out of individual tags at that quantity. |
|
Thanks. How does the TCP connection setup/teardown work in the library? Does it reconnect on each poll, or is the TCP connection left open for the entire session (unless timeout, of course)? |
|
It opens a connection to the processor once and then sends EIP messages for different read/write operations. The connection to the PLC is left open the entire time. I’ve had connections left open in production for at least several months at a time. Possibly longer; I haven’t really checked beyond that. I’ve been using this in production for 2 years though with lots of installations. |
|
I did just a little testing on this. I was on a LAN with a 5069-L330ER processor. I created an array of 1000 DINT and another array of 1000 REAL. Then I added them to a tag group and timed the tag group read. It was 220ms for all 2000 tags. 115ms if I limited it to the first 500 elements of each array. And 27ms if I only did the first 100 elements of each array. |
|
De-lurking for a minute. I have a similar library in C, but I thought I would share my experiences here. There are a combination of factors that can impact performance. These are not in order.
For maximum performance I use connected messages to negotiate large packets where possible and request packing where possible. I easily get an order of magnitude performance increase when stacking all those. Final note: I have found in my testing that the PLC will drop the connection without warning when using connected messaging at least after about five seconds. Part of that time delay is probably due to how the connection is negotiated on my part but I have not been able to change it. So my library cleanly closes the connection to the PLC (via ForwardClose and then SessionClose) after five seconds and transparently reopens it when the client application tries to do a read. I cannot stress enough the issue of the PLC closing the connection. All you need is some maintenance tech unplugging something for a couple of seconds and your connection to the PLC will be gone. I had no idea that this was happening but when I finally got all the automatic disconnect/reconnect logic working correctly, my users' reported problems dropped significantly. I hope some of this is helpful. |
|
Ugh. I left out an important part about connection drops. They only happen if you stop traffic to the PLC for some reason. If you have a continuous flow of requests, the connections stay up. |
That's amazing. Apparently the L35E just can't handle that much traffic. I had no idea there would be such a difference between the L35E built-in and a standalone NIC. Additional info: (Reading 1000 DINT and 1000 REAL tags in one tag group. PLC is programmed to add random values to all 2000 tags every 100ms) Tests on i5-7200 PC (2.5GHz), wired Ethernet 100Mbit, PC cpu utilization at 6-10% Tests on Raspberry Pi 3B+ rev 1.3, Wifi 2.4GHz, PI cpu utilization at 2-4% So could it be a combination of PLC CPU, network, and computer? |
|
I’m not sure. How do you have your overhead setup in the controller properties? I think I used to set it up to maximize comms on those older processors. |
|
Here is what I get (I don't have an array of REAL, but I read an array of 1000 DINT twice). The PC is a Dell XPS 13 (2018 model) under Ubuntu Linux 20.10 and the network is crap: laptop WiFi -> powerline Ethernet -> ancient 100Mbps switch -> PLC. The PLC is a Control Logix chassis with multiple Ethernet and CPU modules. In the following I hit an L81 CPU module via two paths, first through the 1Gbps port on the CPU module and then through an ENBT module. Direct port (1Gbps): Creation of 2 tags took 90ms. ENBT: Creation of 2 tags took 294ms. You can see how much variation I get (mostly due to the WiFi but the powerline Ethernet is not good either). Again, note that this is hitting the same CPU module for both tests. I also have an L55 CPU on that same chassis with an equally sized tag: Creation of 2 tags took 317ms. Definitely worse, but not by a lot. The biggest difference is that when I hit the L81 on its built-in port, I can negotiate a 4002-byte packet size. This is via one of the stress test programs I have for my library. It hammers the PLC by reading a tag (or tags) over and over with no delay in between the reads. Unfortunately I do not have a CompactLogix for comparison. |
I am loadtesting the library to a CLX L35E. I am subscribing to 1000 integer tags and 1000 float tags at 250ms scan rate to test the load capabilities of the system. I am simultaneously running multiple instances of this nodejs script to test multiple connections to the tags and compare to connections from native DASABCIP drivers in Wonderware.
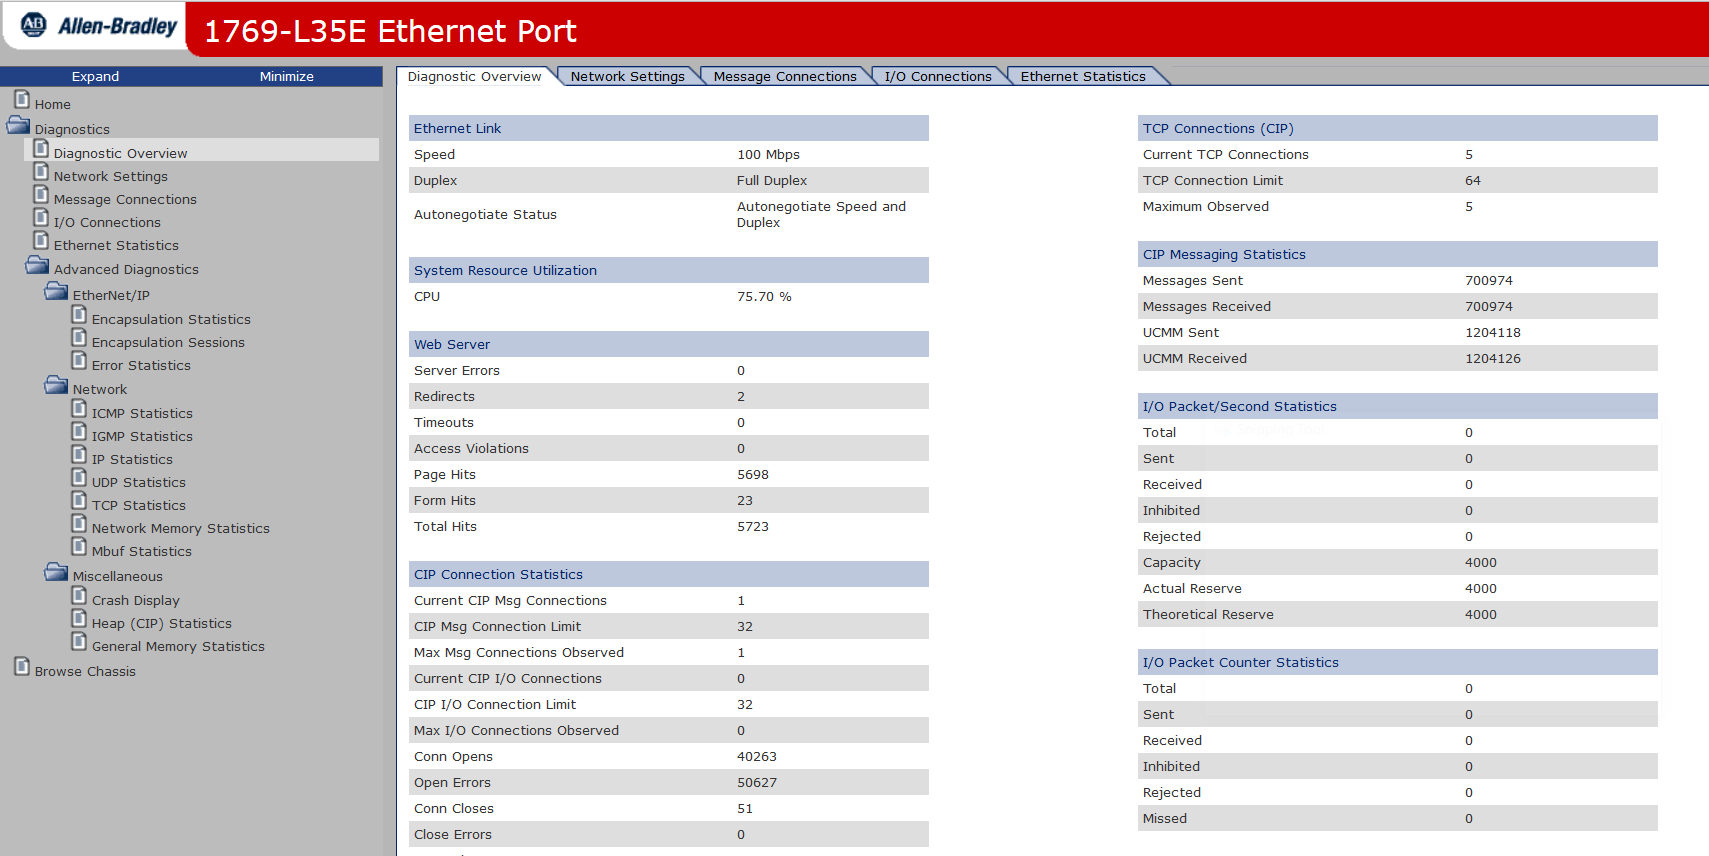
I am observing the L35E's CPU utilization to be around 75% with 4 simultaneous nodejs scripts running, each one subscribed to 1000 dint and 1000 real tags.
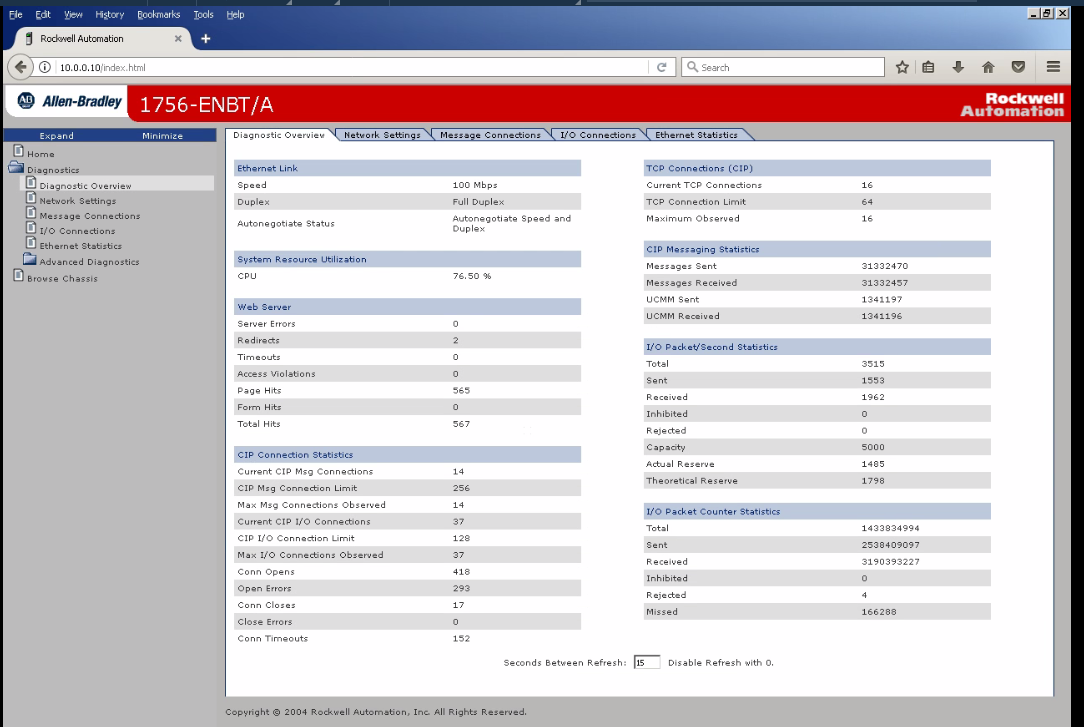
I am comparing this with a production PLC being polled by Wonderware DASABCIP, for around 1000 tags of dint, bool, and float. The production plc is running at around 75% utilization also, but with 16 simultaneous connections (vs 4 simultaneous nodejs tasks).
Ethernet-ip library latency is very high. Even at a scan rate of 250ms, the subscription notifications only happen around every 5 seconds, even though the tags are being changed on the test plc every 100ms (so for every scan, they should have different values).
After testing for a couple of hours, the PLC's status page reports many thousands of Conn Opens and Open Errors as well as Conn Timeouts. When compared to the production PLC (running for many months with no power cycle), only a few hundred of each of these are present. See the two screenshots below.
I think the library is dropping and re-connecting too frequently. IMO the TCP connections should be left open permanently while the script is running, only reinstated if a connection error occurs. The overhead of re-establishing these connections may be introducing the aforementioned latency and higher CPU utilization. I'm not sure, however, why there are so many Conn Errors being reported, unless the old TCP connections aren't being torn down properly.
Here's a screenshot of the test PLC's status, after running tests for only a couple hours:

Here is the live PLC, running many months with 16 simultaneous connections serving at least 1000 tags via DASABCIP driver:

Please let me know how I can reduce the connection errors and improve latency in supporting around 1000 to 2000 tags without killing the PLC's CPU.
Thanks!
The text was updated successfully, but these errors were encountered: