 The story of event logging begins at sea and is related to navigation. One of the important aspects of navigation is dead reckoning: estimating your current position based on course, speed and time from a known, observed point. In the end of 15th century, speed at sea was measured with a small wooden log. A so-called ‘Dutchman’s Log’ was dropped overboard from the bow of the ship and the navigator measured the time elapsing before it passed the stern.
 Building telegram bot using Rust.
 This article describes best practices for standardized logging from the point of view of performance, debuggability, and security.
 Console statements create performance or security issues if you mishandle them. This article explains three ways to remove them from your production build.
 You are reading this content, which means that you are not novice to the microservices field. So let me just scratch the surface of it before moving to Observable Microservices. Once upon a time Monolith Application was now transformed into Microservices based application.
 TelemetryClient vs ILogger or how to improve logging experience in C# ASP.NET for Application Insights
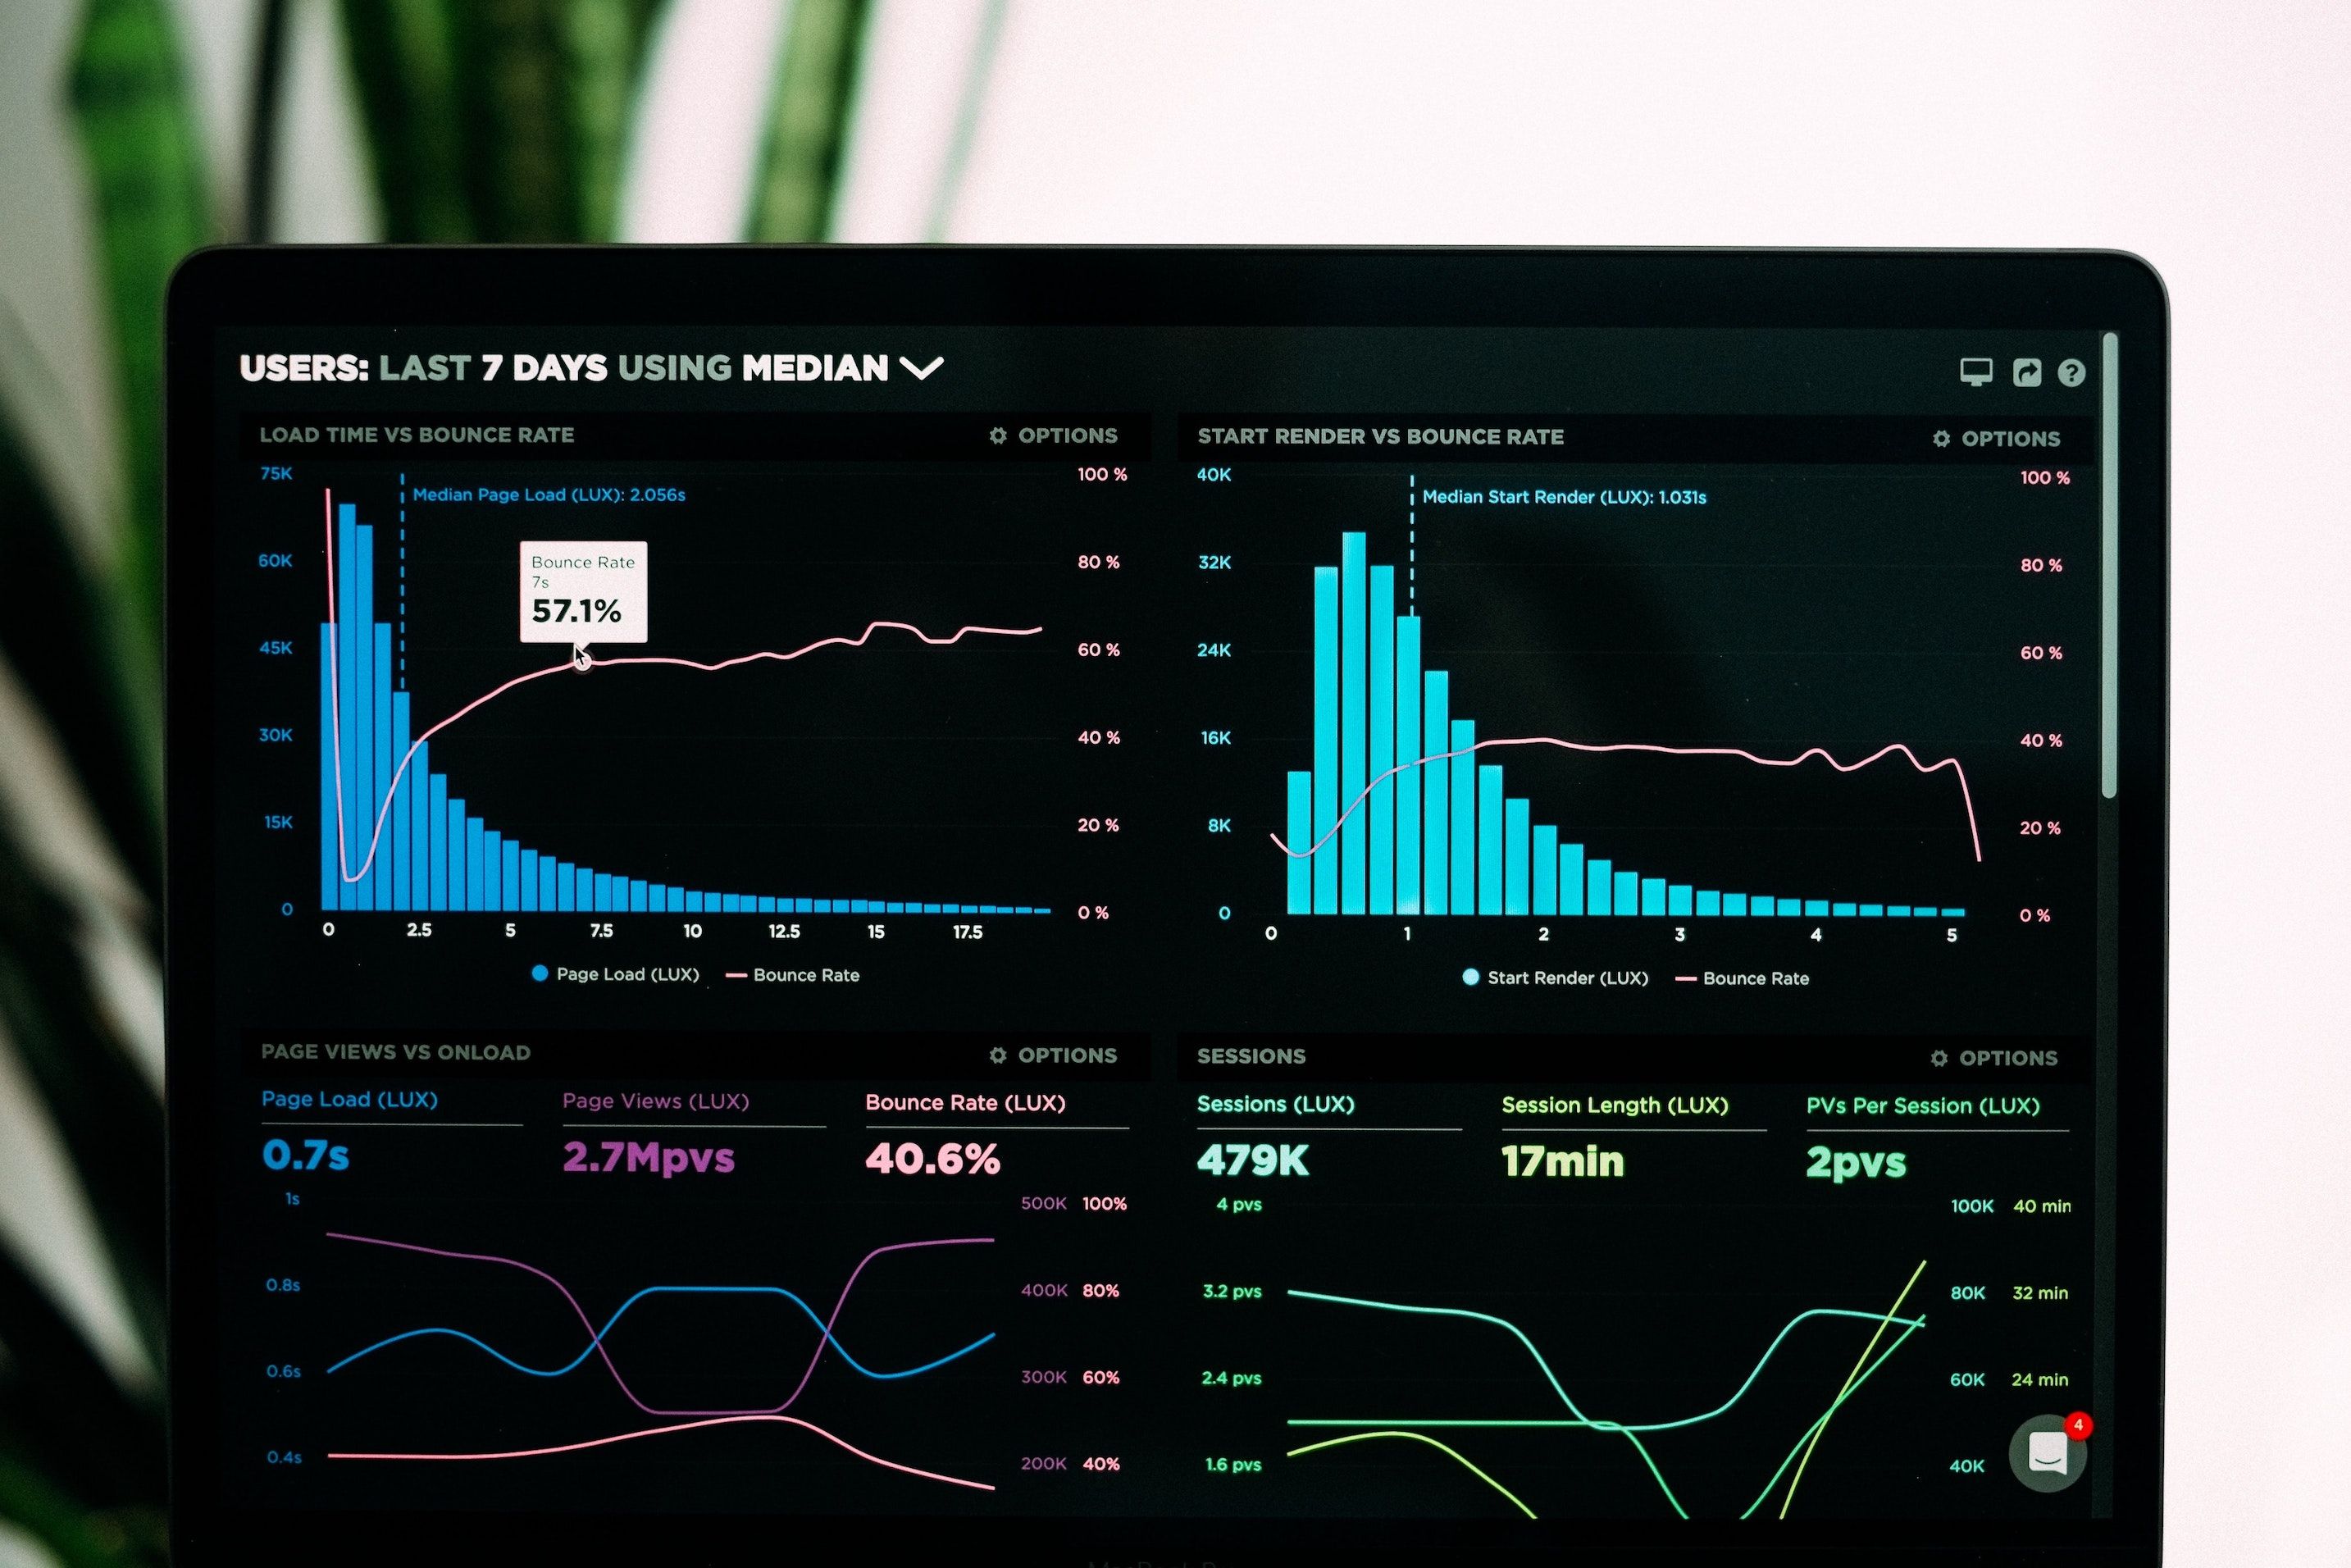
 Monitoring has been a basic system to track the health of servers for years. Now it is not enough.
 In this article, I will cover most debugging methods, basic and modern ones, introduce some hands-on tools and show some basic configurations and instructions.
 Logging and monitoring are like Tony Stark and his Iron Man suit, the two will go together. Similarly, logging and monitoring work best together because they complement each other well.
 Cloudwatch is an AWS service that allows storage and monitoring of your application logs from an array of AWS services. This can be really useful for creating alerts to notify developers when a certain threshold of errors has been hit, but sometimes we might need to deeply analyse our logs, not only to spot errors but to find insights into our application and improve performance. This is where an ELK (Elasticsearch, Logstash, Kibana) stack can really outperform Cloudwatch. ELK allows us to collate data from any source, in any format, and to analyse, search and visualise the data in real time.
 Opinion piece: What we can learn about documentation and logging
 Sidekick is a live application debugger that lets you troubleshoot your applications while they keep on running. Here is how you can start using it in 5 minutes
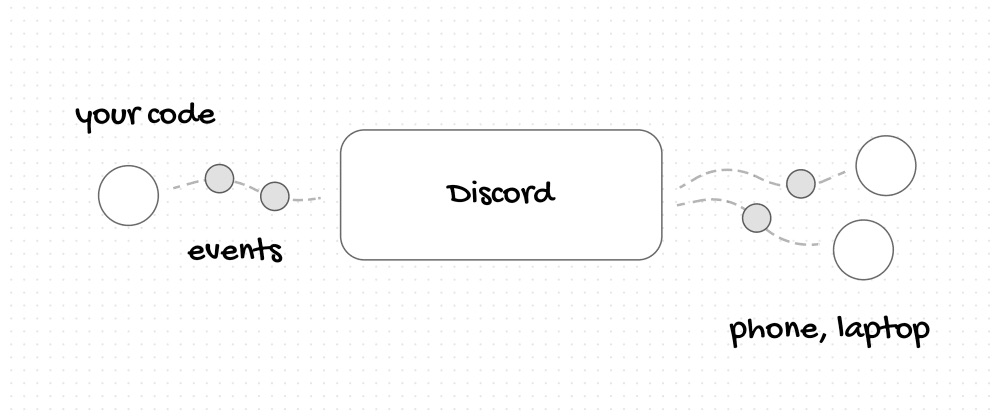 How to Send your Events and Logs to Discord via Python
 As Eventbrite neared the release of their rewritten platform in React.js, they knew observability on the frontend was a problem they needed to solve.
 Power up your logging and build good developer habits. As your codebase grows you'll need to debug it more easily and one tool is logging.
 In this article, I want to describe how to work with logs, analyze them in the command line, and we will consider new modern tools to visualize logs.
 Power up your logging and build good developer habits. As your codebase grows you'll need to debug it more easily and one tool is logging.
 Cloud rose to fame on the banner of cutting costs but with its tremendous growth the spend is rocketing. Learn how you can cut down overspend.
 In our last post, we looked at how to auto-record Amazon Interactive Video Service (Amazon IVS) live streams to an Amazon Simple Storage Service bucket.
 Logging and Monitoring… this I tell you, brother. You can't have one without the other.
 An alternative logging strategy to make loggers your friends, not enemies
 It's crucial to safeguard CloudTrail logs and enhance the security of them, to meet compliance regulatory requirements and internal business needs.
 Logging and Monitoring… this I tell you, brother. You can't have one without the other.
 Kubernetes (a.k.a K8s) is the de-facto standard of container orchestration software backed by Google and one of the most active open source projects. If you are using Docker it is very likely that you are using Kubernetes or at least have heard about it.
 rsyslog vs journald vs filebeat
 Melhore a obsevabilidade da sua Stack Elastic, baseado em fatos reais
 We use annotations to denote transactional behavior in modern Spring so we have no code, no failure, no debugging... But is it really?
 Can you think of any popular VPN service out there that doesn’t have a big “NO LOGGING” tag attached right on front of it?
 10 of the best Node.js logging libraries + how to get up and running with them. 1. Pino, 2. Winston, 3. Bunyan...
 Learn standard practices you should take advantage of when dealing with logging. Make the logging great again.
 Logging is one of the most important parts of software systems. Whether you have just started working on a new piece of software, or your system is running in a large scale production environment, you’ll always find yourself seeking help from log files. Logs are the first thing people look for when something goes wrong, or something doesn’t work as expected.
 Several years ago, I wanted to have my own performance monitoring solution, so I could monitor all enterprise applications. Few enterprises implement this core cross-cutting application task across the enterprise in the same way. By the phrases “core” and “cross-cutting” I mean a feature or functionality set that touches all application development; it’s not specific to a single application. I think some functionality that is repeated across the enterprise should be done the same standard way.
 Let’s discuss a few rules of thumb for logging in Go, as well as some features you may not have heard of that can make debugging easier.
 There’s a short answer, and a long answer. The short answer, that will satisfy your needs in the vast majority of cases, is:
 In this tutorial, we will look at PHP logging. Specifically, we will learn how to configure logs, how to show logs, and how to employ best logging practices.
 The beginning of automated tests in a project is easy and difficult at the same time. You can start smoothly, using base architecture, simple tests and more.
 By writing your tool, you gain more customization options, versatility, and other enhanced capabilities that can enrich your processing.
 The concept of instrumentation often refers to tracing where events happen in an application. Many application performance monitoring (APM) tools use it to provide metrics on the inner workings of your application. But sometimes, all you really need are details about API calls.
 Occasionally you need to process some HTTP server logs and extract analytical data from them.
 In this second part of our series, we explain five additional tips to help you code more securely, from leveraging existing frameworks to protecting data.
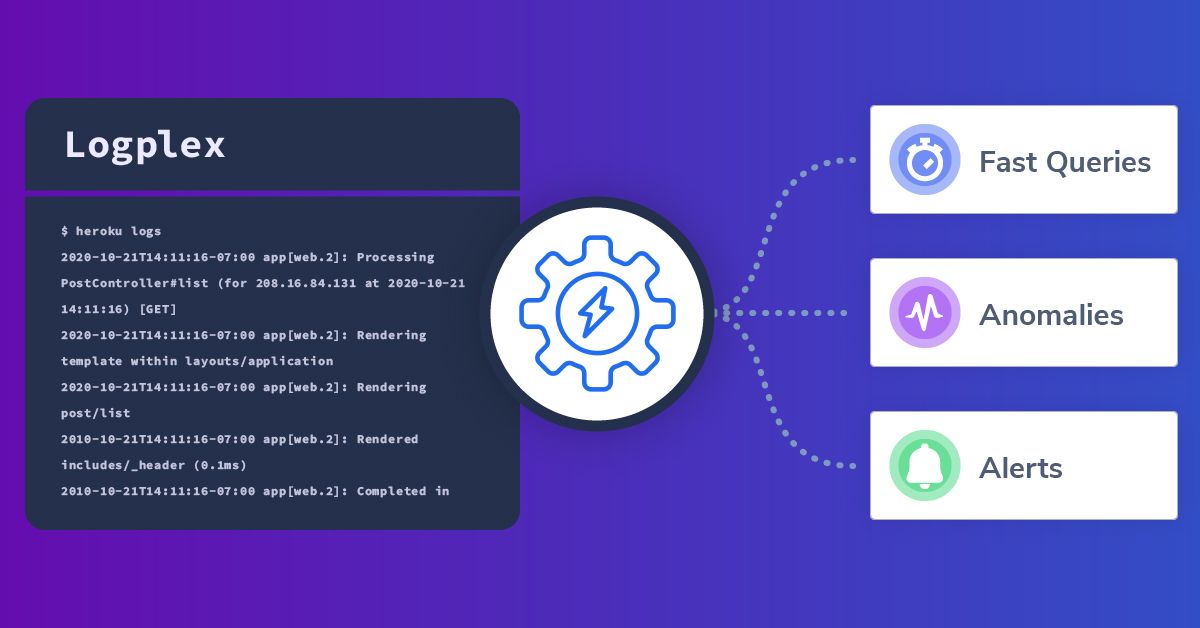 Heroku differentiates itself from other cloud providers, by offering a complete, cohesive environment. Where AWS and GCP present a decoupled toolkit, Heroku strives for a seamless, UI-driven experience for the user. This philosophy is clearly embodied in its metrics functionality, which is often a single click or basic configuration file away.
 Just because we do something one way, doesn’t always mean it is the right way … or even the best way.
 Logs are everywhere in software development. Without them there’d be no relational databases, git version control, or most analytics platforms.
 In this story we will try to see how to improve a simple REST connector that places a request on an external service through an HTTP POST call and returns the result back from the remote server.
The full example can be found here.
Following is the source code for our connector (Connector1):


