A curated list of tools to map distributed system to graphs and display them
| Name | Description | Requirements / Technology | Focus / Data Source | License |
|---|---|---|---|---|
 cartography |
Cartography is a Python tool that consolidates infrastructure assets and the relationships between them in an intuitive graph view powered by a Neo4j database. | Python, Neo4J | AWS, GCP, GSuite, Okta, GitHub | Apache 2 |
 cloudmapper |
CloudMapper helps you analyze your Amazon Web Services (AWS) environments. | Python | AWS | BSD 3 |
 kiali |
Kiali provides answers to the questions: What microservices are part of my Istio service mesh and how are they connected? | Go, docker, openshift | Istio | Apache 2 |
 kong-map |
Kong-map is a free visualization tool which allows you to view and declaratively edit configurations of your Kong API Gateway Clusters, including Routes, Services, and Plugins/Policies. The tool is available for installation on Docker and Kubernetes only at this time. | Docker | Kong | AGPL |
 micromap |
Micromap is a suite of command line tools to generate a visual representation of your application dependencies. | Go,GraphViz | custom, handwritten | EPL |
 microservice-graph-explorer |
Navigate and explore all of the microservices in your application in real time using the real application connections. | docker | custom health checks | Apache 2 |
 newtonjs-graph |
Cloud Architecture Graphs for Humans | Docker (Java) | Rancher, K8s, custom input | AGPL |
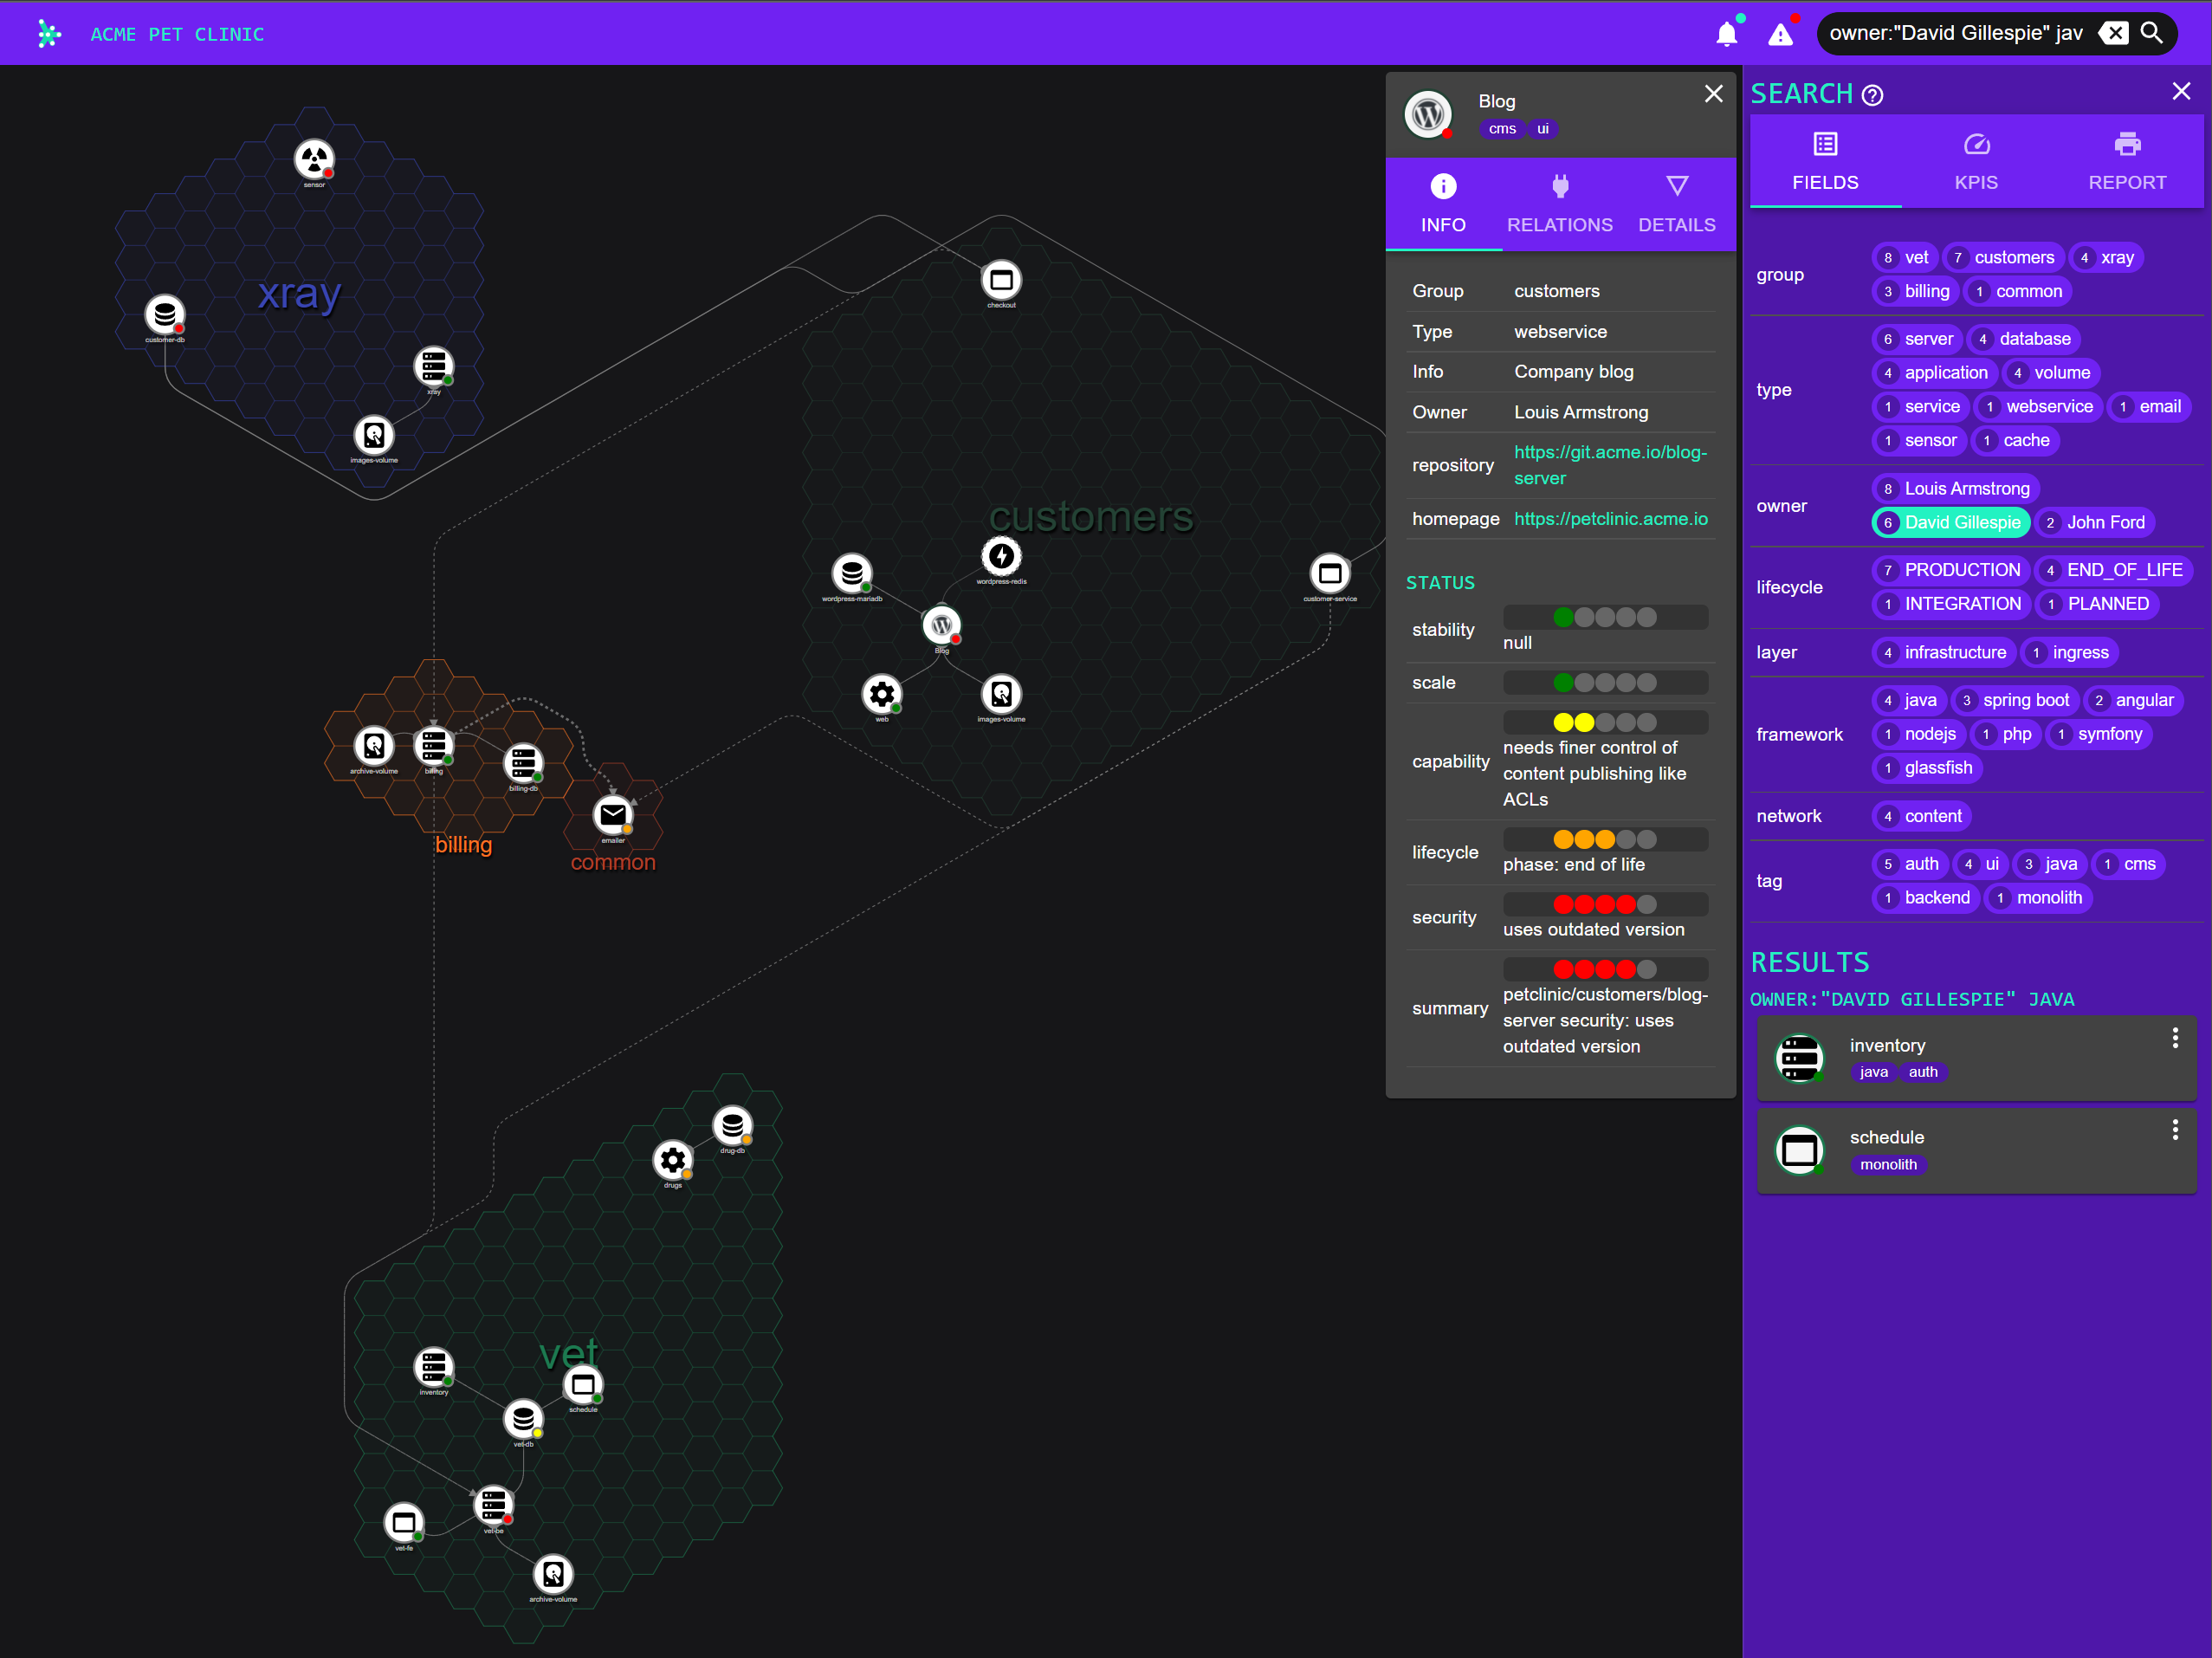 nivio |
Nivio is application landscape management for teams (developers, operators, managers). It follows a bottom-up no-op approach, i.e. there is no interface for manual data maintenance. It is designed to gather the application landscape information from configurable items, preferably code repos. | Docker (Java) | Rancher, K8s, custom input | AGPL |
novatec-service-dependency-graph-panel |
The Service Dependency Graph Panel by Novatec provides you with many features such as monitoring your latencies, errors and requests of your desired service. This interactive panel for Grafana will help you visualize the processes of your application much better. | Grafana | Grafana Metrics | Apache 2 |
 pivio |
Microservice documentation for your platform. | Docker (Java, client-server) | custom | Apache 2 |
 statusgraph |
A status page for your distributed system. | Docker (Go) | Prometheus | MIT |
 vistecture |
Visualize Architecture: Microservice Architecture Tool for visualizing, analysing and automatic documentation of (distributed) Software Architectures | Docker (Go) | k8s, pivio, custom DSL | Apache 2 |