-
Notifications
You must be signed in to change notification settings - Fork 143
Devel GTK Useful Eclipse shortcuts
Often you will find that Eclipse has many tools useful for dealing with the nuances of the SWT code base.
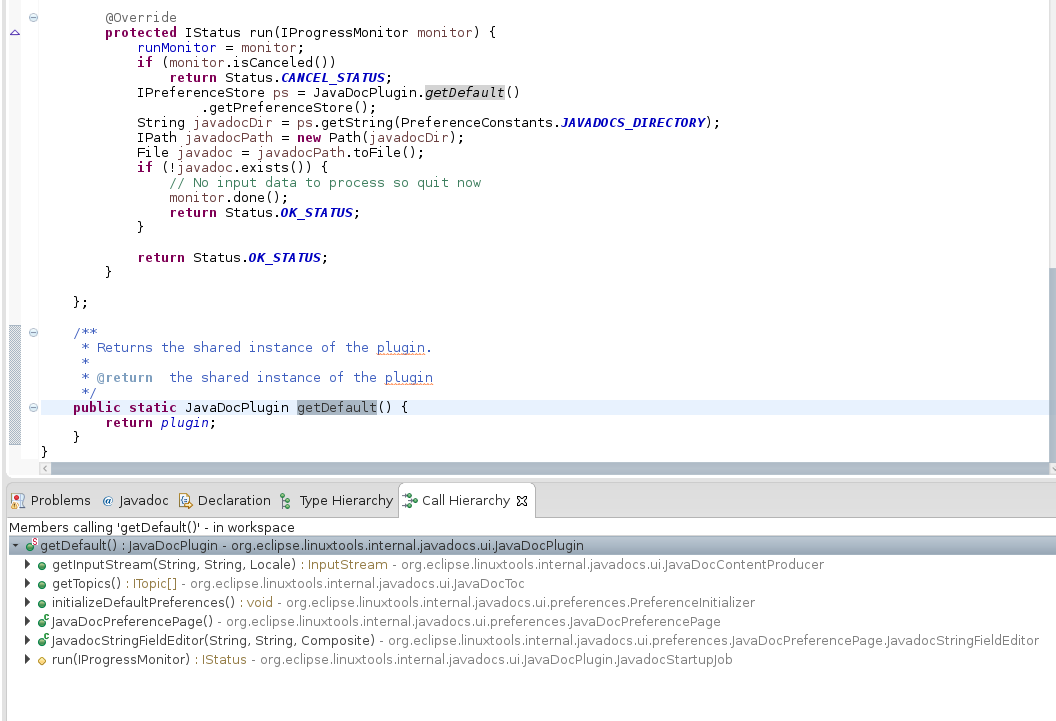
This tool, bound by default to Ctrl + Alt + H, is very useful for looking at which functions/methods call one another. I usually bind this to F1 (since I use it often and F1 is unbound), but that is totally a matter of personal preference.
If you are interested in what calls a certain method, simply move the cursor on it and type Ctrl + Alt + H, your keybinding, or right click, select "Open Call Hierarchy". A tabbed view will open in the bottom portion of Eclipse (by default) and a function hierarchy will be displayed.

This tool, bound to F3 by default, displays the original declaration of a function. To use it, move the cursor over the name of the function/method and press F3, your keybinding, or right click and select "Open Declaration".
Sometimes functions/methods are overridden somewhere and you need to see where this occurs. To view the implementation of a function/method, hover the cursor over the function/method name, and hold Ctrl. A menu will appear: click "Open Implementation" instead of "Open Declaration".
Often it is useful to print stack traces to post on Bugzilla, Gerrit, etc. in order to assist with debugging. Usually Eclipse only prints a stack trace in the event of a crash, but it is also immensely useful to have Eclipse print stack traces on every breakpoint.
To accomplish this, add this expression to the "Expressions View" in the Eclipse Debug perspective:
new Throwable().printStackTrace();
Now Eclipse will print a stack trace in the console after every breakpoint.