Processing sketch to visualize GPX routes from Strava
- Login to your account on Strava.com
- From the main drop-down menu at the top of all Strava pages (under your name) select "Settings". From the lower right of the screen, select "Download all your activities"
- Once you have received the archive of GPX files from Strava, unzip the archive and move all of them in to the "data" folder of this sketch.
- Once you run the Processing sketch, it will take a little while to index all the routes and geocode the regions. Progress will be output to the console.
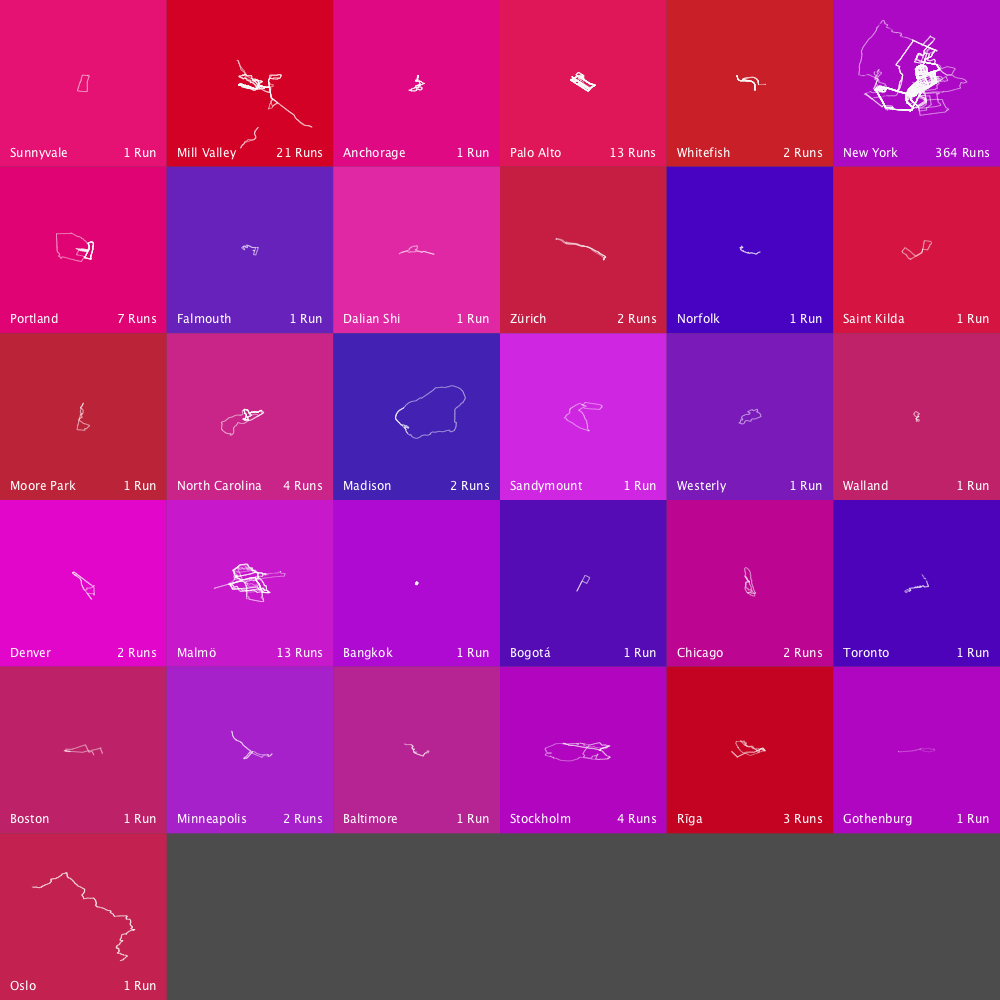
- After the sketch has successfully run, it will save a PNG file with a timestamp into the app directory.
- All runs are displayed at the same scale.
- This sketch has not been tested with more than 500 GPX files or with cycle data.
- The data folder comes pre-populated with 1 GPX file so that it will run if you do not have data of your own.
- The sketch will automatically adapt the size of the mosaic to fit the number of locations.
- To adjust the size of the regions being calculated, edit the "locationGranularity" constant.
- To adjust the size of the box margins, edit the "boxMargin" constant.