Releases: gampleman/elm-visualization
1.6.1
1.6.0
This release changes a lot of the code under the hood. The main change is our migration to use folkertdev/one-true-path-experiment for handling paths. Therefore Visualization.Path is now deprecated and will be removed on the next major release.
To ease transition, there is a function that allows converting things in the current format for paths into something compatible with that package.
This means we now support an impressive list of Curve functions:
linearCurvebasisCurveOpenbasisCurvebasisCurveClosedbundleCurvecardinalCurvecardinalCurveClosedcardinalCurveOpencatmullRomCurvecatmullRomCurveClosedcatmullRomCurveOpenmonotoneInXCurvemonotoneInYCurvestepCurvenaturalCurve
We also added radial versions of Shape.line and Shape.area.

Finally, the text formatting of Scale.tickFormat has been improved for Linear Scales.
1.5.0
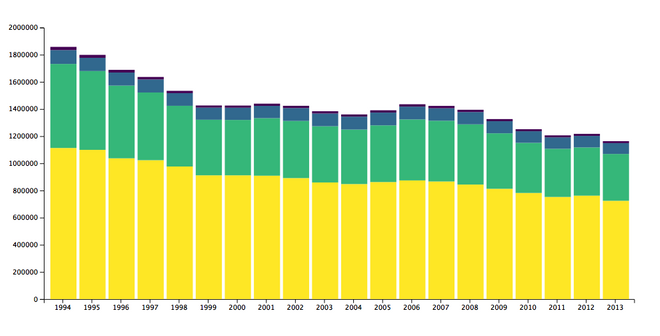
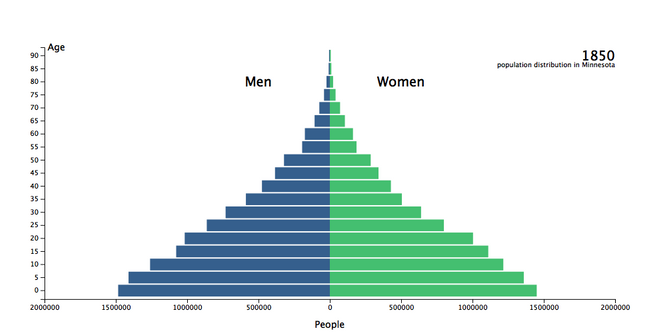
Stacks
This release brings in functions to construct stacked charts. This enables the obvious charts:
What's awesome is that this also enables you to build streamgraphs:
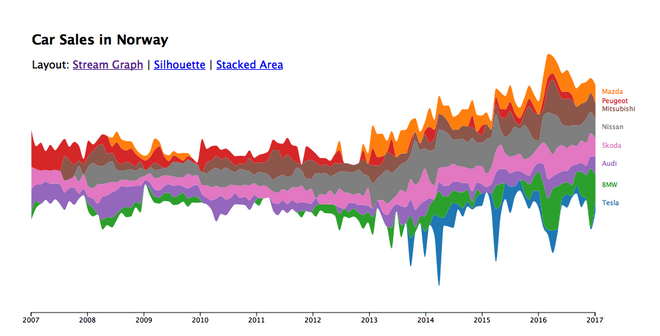
Check out the Stack docs!
Many thanks to @folkertdev for contributing the code that makes up this release!
1.4.0
Histogram
Adds a new module for computing Histograms from data.
Scales
-
Added
OrdinalScales -
Added
BandScales that can be made compatible with Axis viaScale.toRenderable -
Added
category10,category20a,category20b,category20cordinal color schemes -
Added
infernoInterpolator,magmaInterpolatorandplasmaInterpolatorcolor interpolators -
Documentation improvements
-
Fixes QuantizeScales not working properly
-
Fixes quirky behavior in
Visualization.List.range
1.3.0
1.2.0
1.1.1
1.1.0
v1.0.0
Initial release featuring:
- Scales to transform data from data space to screen space:
- Linear
- Log
- Time
- Sequential
- Quantize
- Axis to render scales on screen
- Shape generator for generating chart shapes
- A canvas inspired abstraction over SVG paths
- Some utilities for handling data.