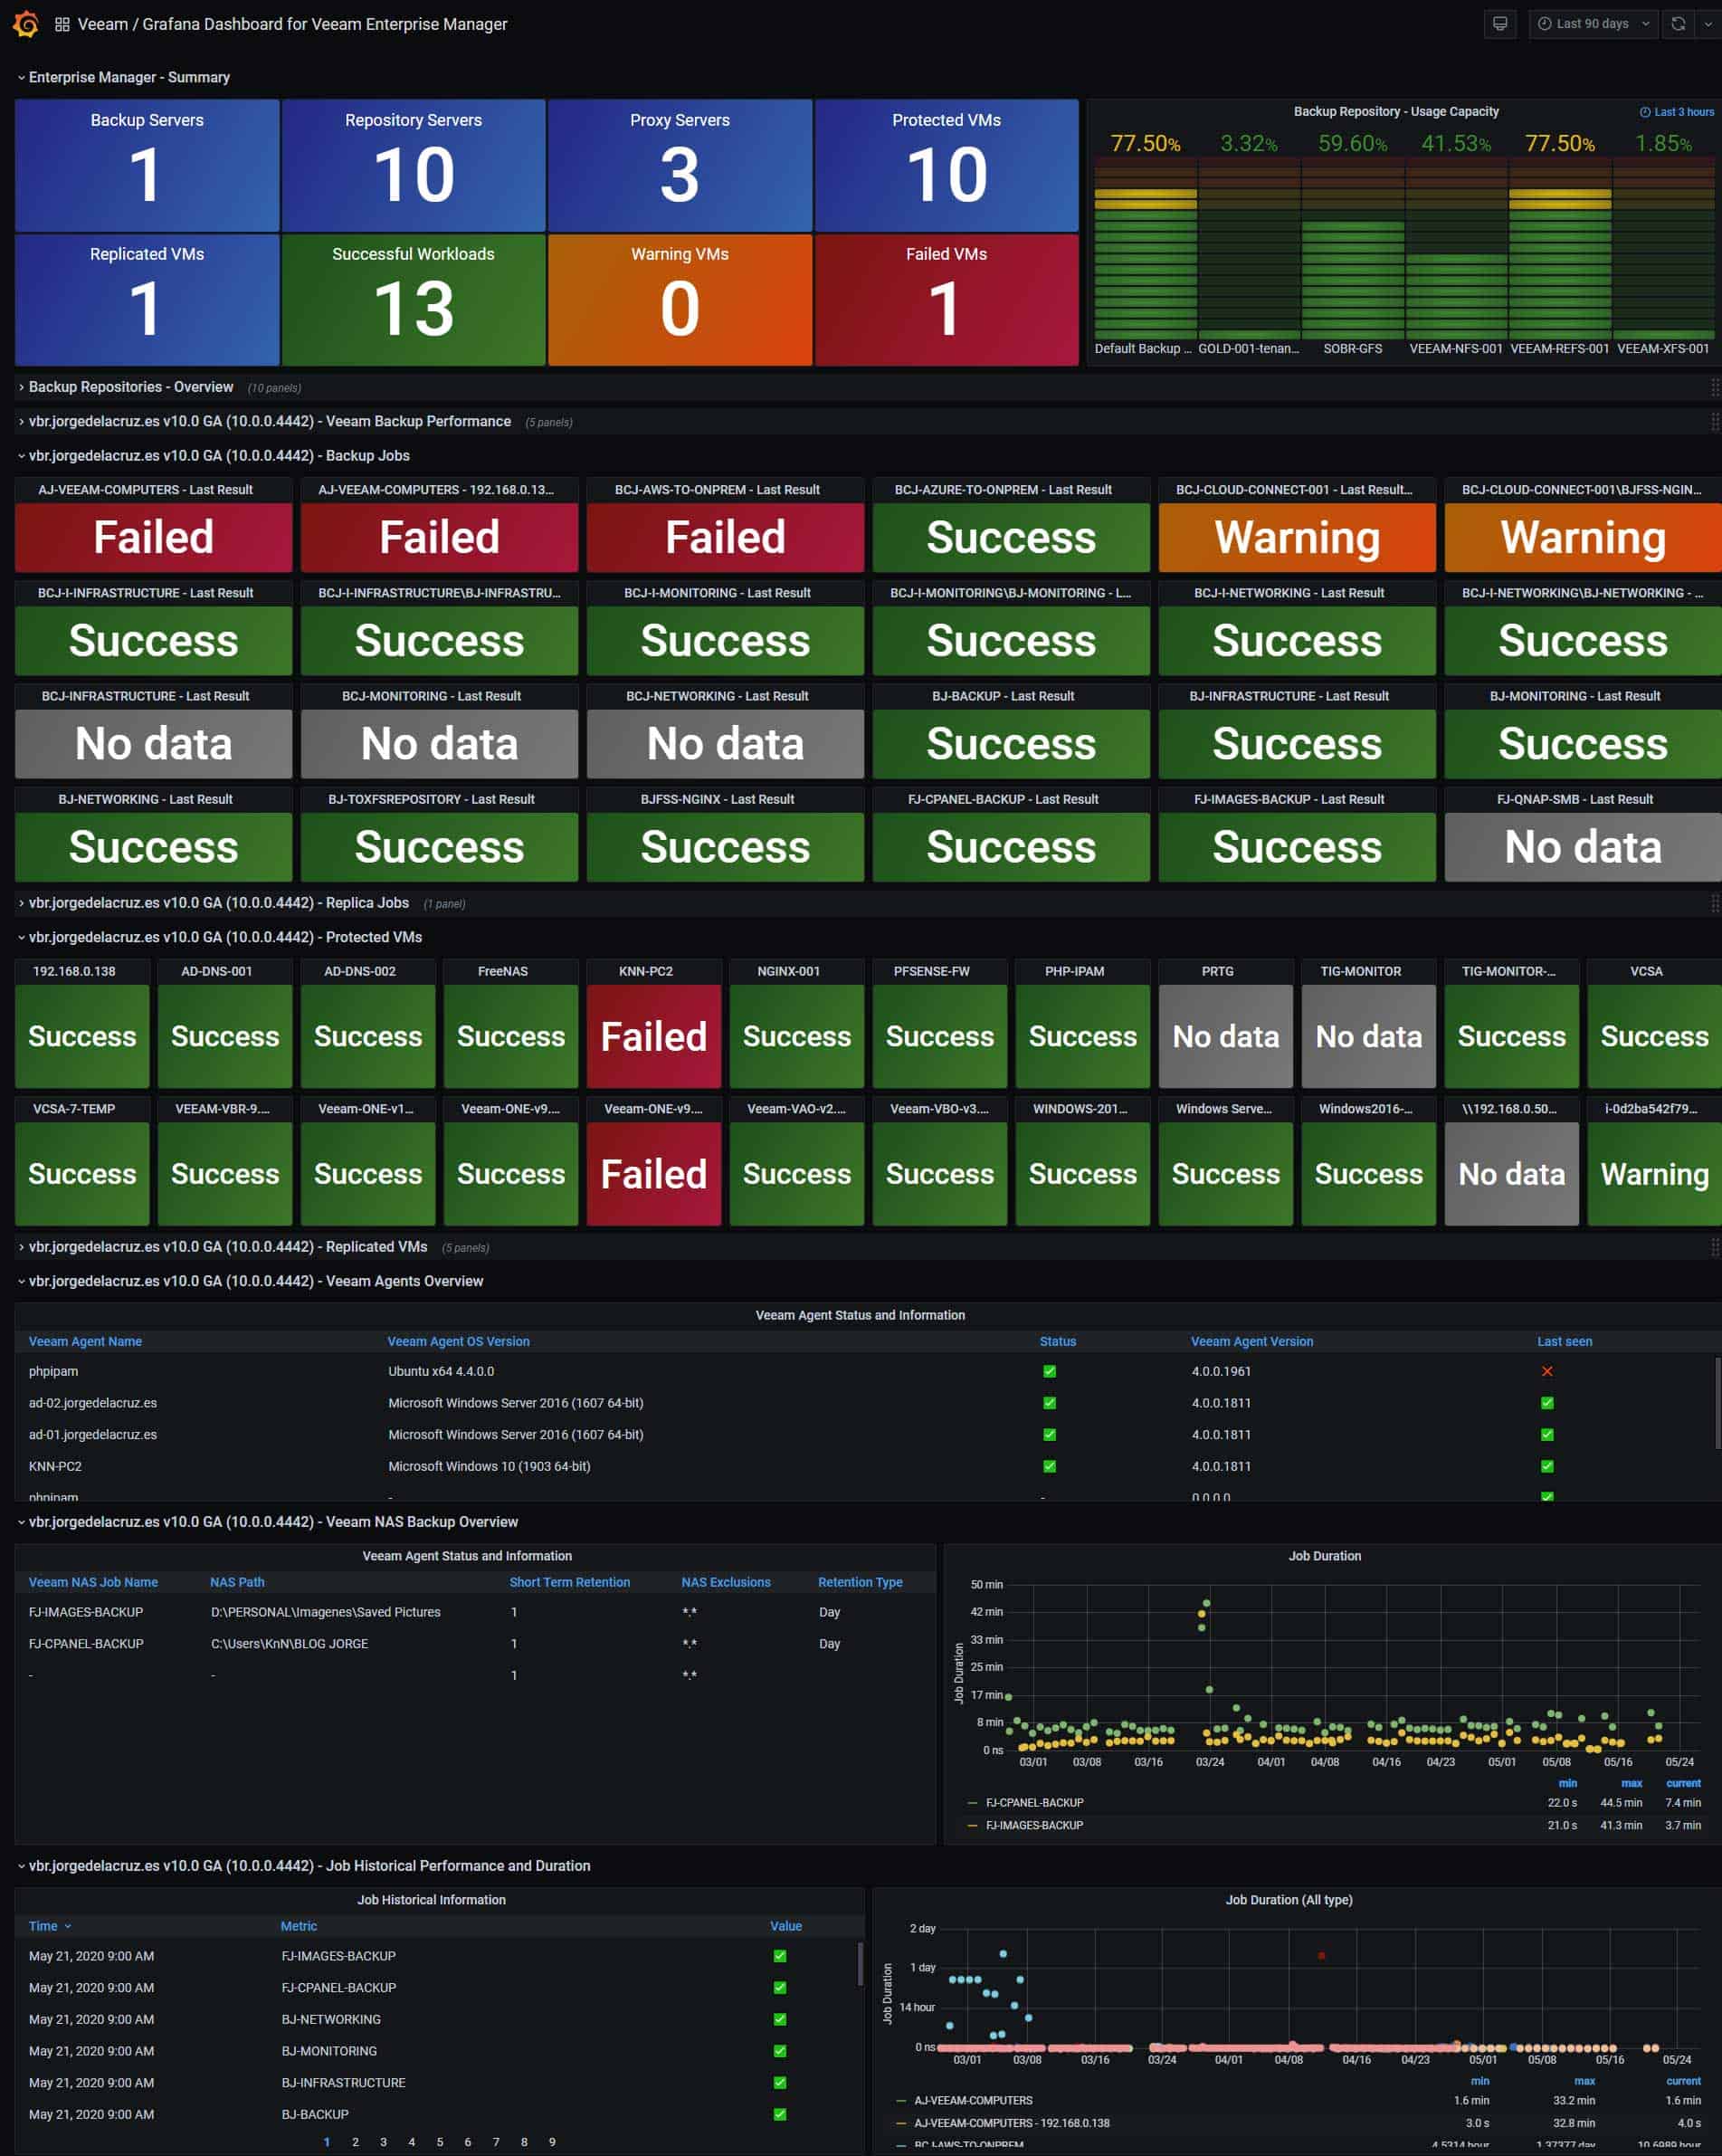
Thanks for the interest on this project.
Please follow the next instructions in order to start monitoring your Veeam Enterprise Manager with InmfluxDB v2.0 - https://jorgedelacruz.uk/2020/01/07/looking-for-the-perfect-dashboard-influxdb-telegraf-and-grafana-part-xix-monitoring-veeam-with-enterprise-manager-shell-script/
Or try with this simple steps:
- Download the veeam-enterprisemanager.sh file and change the parameters under Configuration, like username/password, etc. with your real data
- Make the script executable with the command chmod +x veeam-enterprisemanager.sh
- Run the veeam-enterprisemanager.sh and check on Chronograf that you can retrieve the information properly
- Schedule the script execution, for example every 30 minutes using crontab -e
- Download the Veeam Enterprise Manager JSON Dashboard file and import it into your Grafana
- Enjoy :)
InfluxDB 1.8 Note: If you're using InfluxDB 1.8, use the veeam_enterprisemanager.sh file that you can find inside the InfluxDB v1.8 folder.
Important: For the section called Veeam Backup Performance, you will need to install the Telegraf Agent for Windows on the Veeam Backup & Replication Server. Additionally, you will need to edit the hostname on the telegraf.conf for this VBR Server, and use the proper FQDN, like this:
  ## Override default hostname, if empty use os.Hostname()
  hostname = "yourvbr.yourdomain.com"
- The old PowerShell way to retrieve data (which can still be found inside the PowerShell folder) was created thanks to Markus Kraus: https://mycloudrevolution.com/2016/02/29/prtg-veeam-br-monitoring/
Would love to see some known issues and keep opening and closing as soon as I have feedback from you guys. Fork this project, use it and please provide feedback.
