Many collections of historical aerial photos have not been fully georeferenced, but there may exist rough latitude/longitude coordinates for each photo. In this exercise, we'll take a spreadsheet containing coordinates and turn it into a point-based index map.
- Start a new project in QGIS and add the Google Road basemap
- Add the /exercise2/ny-aerials-1930s.csv by dragging the file onto the map
Adding a CSV in this manner will treat all fields as text strings, which is okay, because we are going to use the Refactor Fields tool anyway, at which point we can specify the data types.
Spreadsheets in the form of .xlsx Excel files could also be used, in which case QGIS should automatically respect the cell types.
- In the processing toolbox, open the "Create Points Layer From Table" tool
- Select the X and Y fields (x=longitude, y=latitude)
- Select the appropriate "Target CRS"
- Click "Run"
In this example, the columns are WGS 84 longitude and latitude. If your data has x/y values in a different coordinate system, be sure to select the appropriate CRS.
Let's explore the values of some of the columns by setting the point color from one of those columns.
- Right-click the "Points from table" layer > Zoom to layer
- Open the Layer Styling Panel and change "Single symbol" to "Categorized"
- Set "Value" to "county", then click the "Classify" button
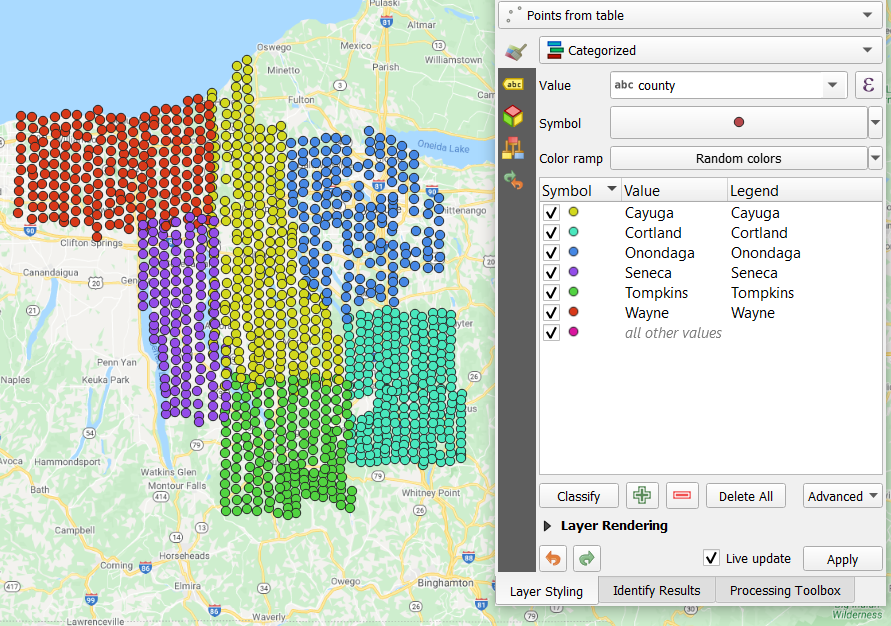
Try categorizing by year, and notice how photos from different years were used to fill in gaps. (This is why we aren't planning to separate out different years into different files.)
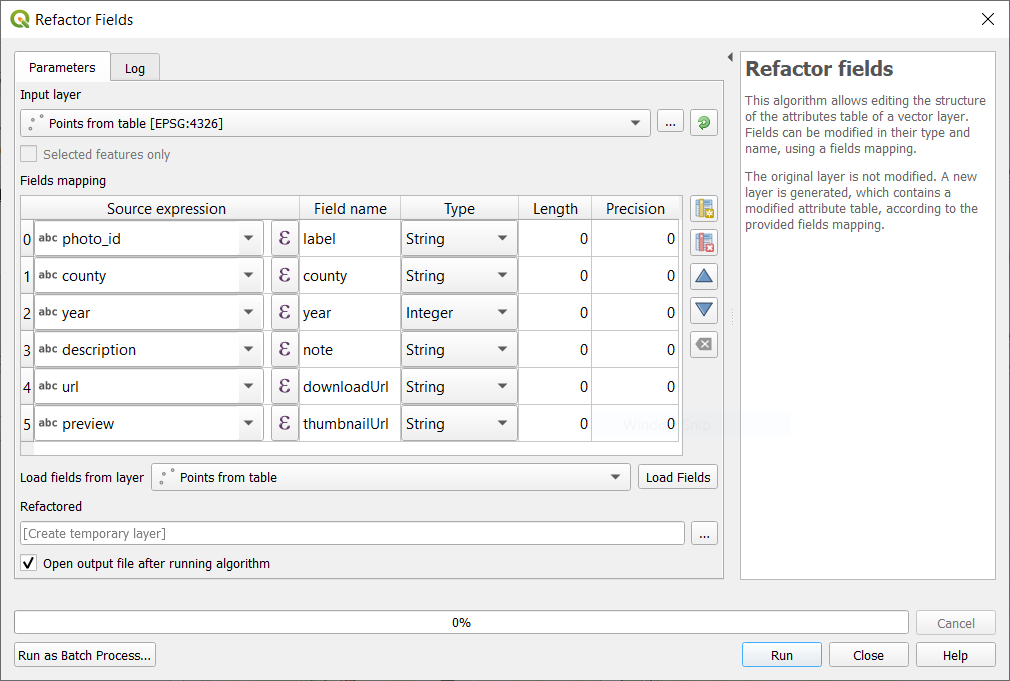
Use the "Refactor fields" tool to rename or delete several of the fields:
- Right-click the “Refactored” layer > Make Permanent…
- Set Format = GeoJSON
- Always click the
...button to specify where you want the file saved! - Under Layer Options, set RFC7946 = YES (this will force it into WGS84, and set decimal precision at 7 digits)
Now we have all the points saved to a single GeoJSON file.
What if we wanted to save each county separately, based on the "county" column?
- Open the "Split Vector Layer" tool
- Input layer = "Points from table"
- Unique ID field = "county"
- Output directory -- click the
...to select a folder - Click "Run"
Next: Exercise 3