This is the repository of team The Transporters for the NEC smart transport hackathon 2019. Developing a platform to facilitate smart public transport using Machine Learning
To know more about our project, check out this overview.
India is home to a large population of people. You require a medium of transport to move from one place to another. In India, the majority of people rely on their personal transport. Hence, this leads to roads congestions, various types of pollution, etc. You are provided with the benefits of public transportation. Your task is to build an application that must encourage people to use public transportation systems.
➤ One Stop Solution to Commuting - Anytime, anywhere in the city !!
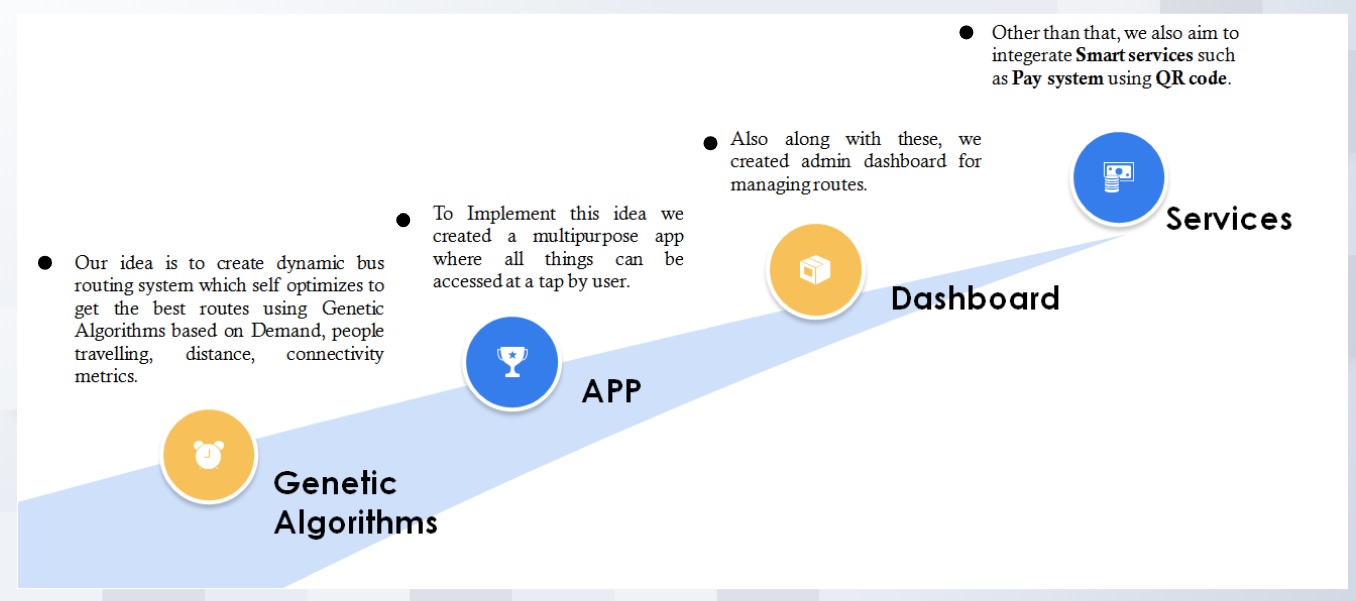
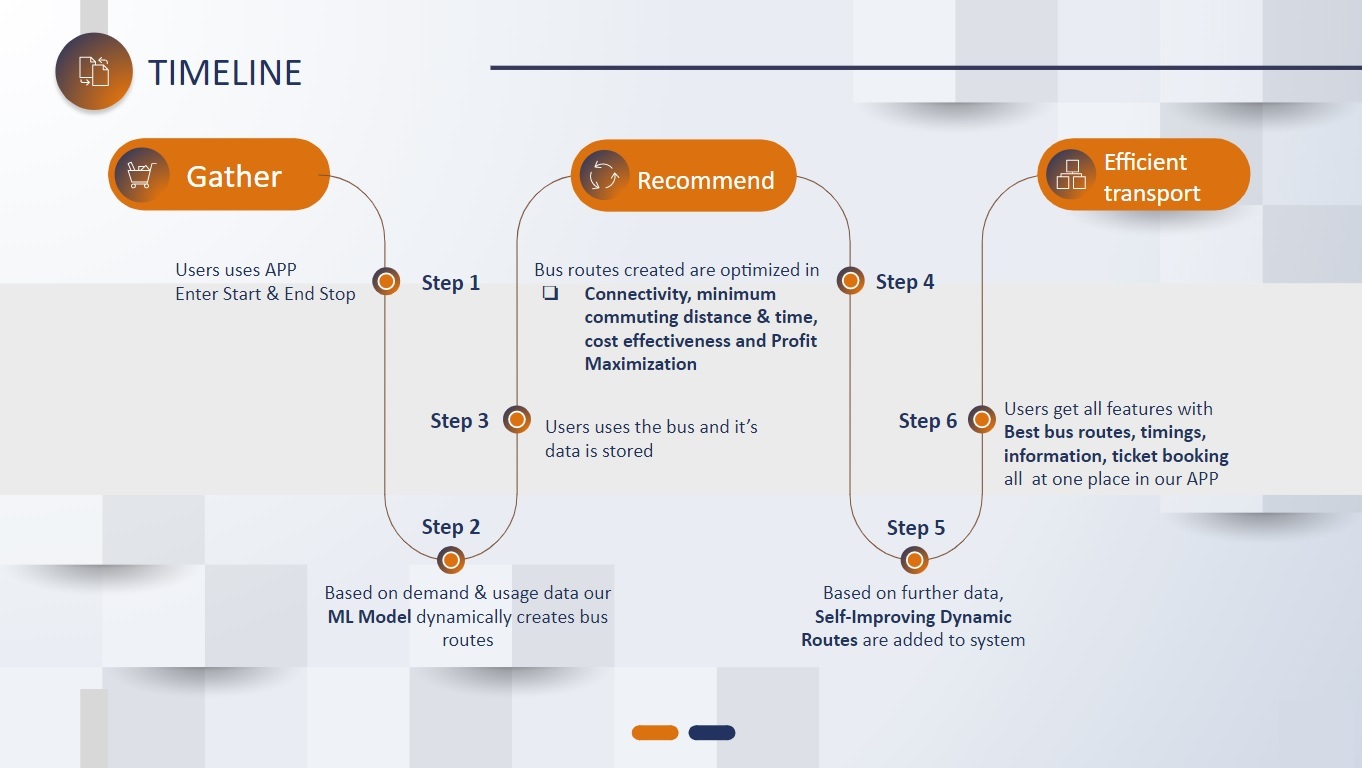
- Dynamically creating bus routes based on demand
- Full integration with internal routes & public flow
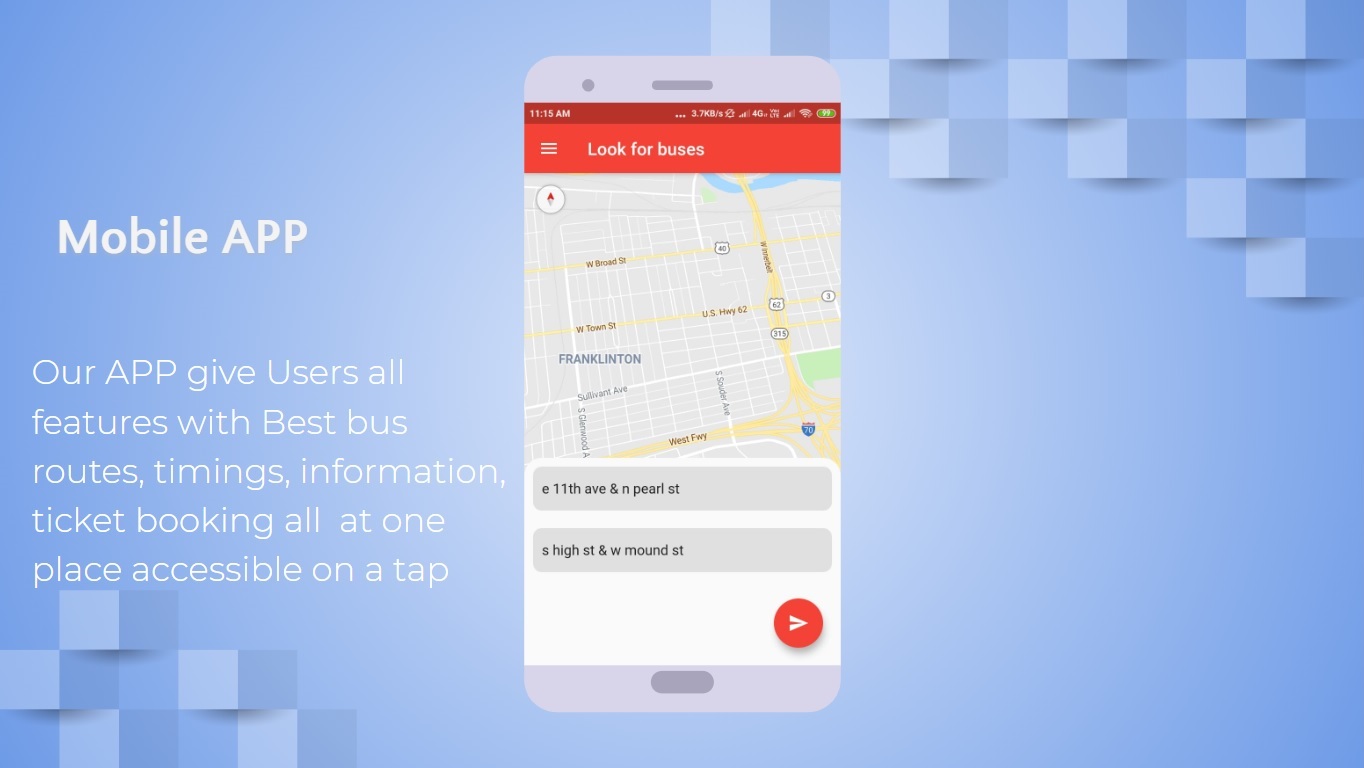
- Android app service for every citizen
- Most Time & Cost effective
- Dynamic Connected route Information at your Tips
- Impactful communication
As input, we expect a list of bus-stops along with their corresponding latitudes and longitudes. Also, each bus-stop needs to have data about how many people got on/off at that stop. An example can be seen in the file: data/may-trimester-2017-stop-ridership-ranking-saturday-csv-9.csv
We suggest a set of optimal routes that maximize the total revenue as well as the total number of people served.
We create a weighted undirected Graph of the given N bus-stops using the given data. The graph is such that the weight between any two bus-stops is given by (r is a hyper-parameter): d(p,q) if d(p,q) <=r 0, otherwise
We find K (< N) bus stops such that the distance between any point on our original graph and one of these K stops is minimized. This problem is known as the Capacitated facility location problem. We derive an approximate solution using Dynamic Programming.
We create a fully connected undirected graph G1 with the K centers found earlier and the edges are weighted by the distance between these bus-stops. A directed graph G2 is also created with the K centers where each node of G2 has 2 weights:
- in: The probability of a citizen getting on the bus at this station
- out: The probability of a citizen getting off the bus at this station.
We, then, use the graph G2 to simulate a population of citizens where each citizen is assigned a source and a destination stop according to the above mentioned probabilities.
We know train a Genetic algorithm to decide on the optimal routes. Each member of this GA population consists of a set of routes along with the number of buses running on that route.
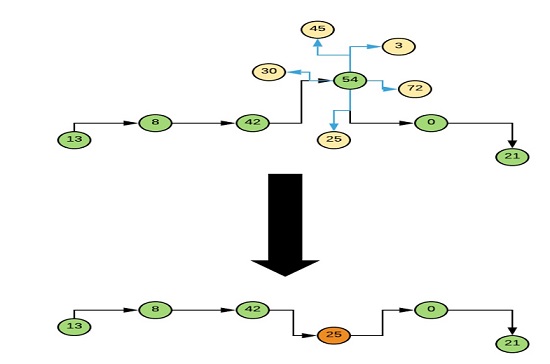
Mutation
The mutation operator replaces a random % of the nodes in any route with one of their closest neighbors.
Crossover
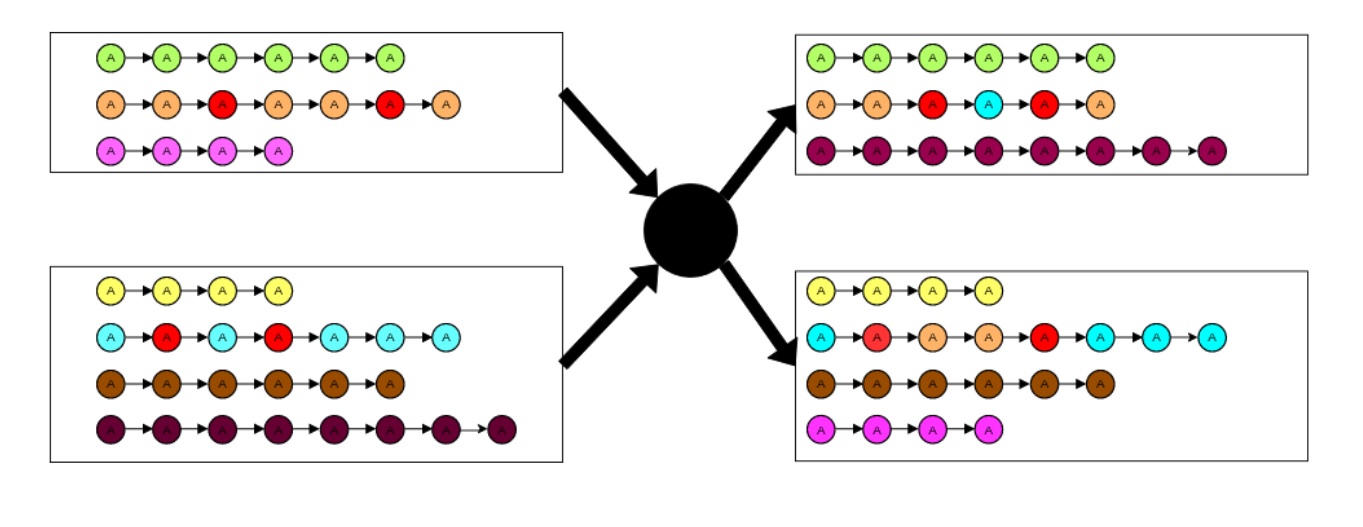
The crossover operator does 2 things:
-
Randomly exhange some % of routes between two members of the GA population
-
Select 2 random routes, if they have 1 or more nodes in common, exchange the path between the common nodes (or till the end of the route if only 1 node is common)
The Fitness function We monitor 3 things while calculating our fitness function
- How much of the total capacity of each bus is fulfilled (in %)
- How many (simulated) citizens were our buses able to serve
- The total length of all the routes for a particular solution.
We designed three seperate solutions and comapared them to the initial routes given in the dataset.
-
Original: The routes given in the original dataset
Profits recorded: - 15,500 Rs
Number of people served: 1136 using 164 buses
-
Economical: The model tries to find routes which optimize only the total revenue
Profits recorded: 1,12,446 Rs
Number of people served: 650 (-42%) using 51 buses
-
People centric: Optimize the model so maximum number of people are able to commute without considering the revenue
Profits recorded: 2202 Rs
Number of people served: 3374 (197%) using 74
-
Resource centric: The model tries to efficiently utilize all the resources in hand - It’s objective is somewhere between that of model 1 and model 2
Profits recorded: 87000 Rs
Number of people served: 2000 (76% capacity) using 65 buses
- Chinmay Hebbar - Backend developer
- Manan Soni - ML developer
- Siddharth Singh - ML developer / App developer
- Sparsh Jain - Frontend developer
