-
Notifications
You must be signed in to change notification settings - Fork 357
Debugging in Eclipse
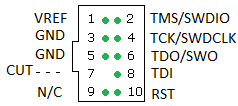
For Jtag/SWD connection you will need to solder on a 10 pin 0.05” debug connector connected to ‘SWD’ port of STM32. As shown in the picture.
For more information the Jtag from Arm Debug Connection Info
The pin layout, pin One is marked with an arrow on the Naze32 Board.
Various debugging hardware solutions exist, the Segger J-Link clones are cheap and are known to work on Windows with both the Naze and Olimexino platforms.
USB-MiniJTAG J-Link JTAG/SWD Debugger/Emulator

ARM-JTAG-20-10 adapter
https://www.olimex.com/Products/ARM/JTAG/ARM-JTAG-20-10/ http://uk.farnell.com/jsp/search/productdetail.jsp?sku=2144328

The Segger J-Link server can be obtained from here
http://www.segger.com/jlink-software.html
make clean TARGET=NAZE
make TARGET=NAZE DEBUG=GDB

use this method if you want to build automatically when launching the debug configuration
make clean TARGET=OLIMEXINO
make TARGET=OLIMEXINO DEBUG=GDB

start openocd:
openocd -f /usr/share/openocd/scripts/board/stm32vldiscovery.cfg
Create a new debug configuration in eclipse :

you can control openocd with a telnet connection:
telnet localhost 4444
stop the board, flash the firmware, restart:
 reset halt
 wait_halt
 sleep 100
 poll
 flash probe 0
 flash write_image erase /home/user/git/baseflight/obj/baseflight_NAZE.hex 0x08000000
 sleep 200
 soft_reset_halt
 wait_halt
 poll
 reset halt
A this point you can launch the debug in Eclispe.
Here are some screenshots showing Hydra's configuration of Eclipse (Kepler)
If you use cygwin to build the binaries then be sure to have configured your common Source Lookup Path, Path Mappings first, like this:

Create a new GDB Hardware Debugging launch configuration from the Run menu
It's important to have build the executable compiled with GDB debugging information first. Select the appropriate .elf file (not hex file) - In these examples the target platform is an OLIMEXINO, not a naze32.
DISABLE auto-build

Choose the appropriate gdb executable - ideally from the same toolchain that you use to build the executable.

Configure Startup as follows
Initialization commands
target remote localhost:2331
monitor interface SWD
monitor speed 2000
monitor flash device = STM32F103RB
monitor flash download = 1
monitor flash breakpoints = 1
monitor endian little
monitor reset


It may be useful to specify run commands too:
monitor reg r13 = (0x00000000)
monitor reg pc = (0x00000004)
continue

If you use cygwin an additional entry should be shown on the Source tab (not present in this screenshot)

Nothing to change from the defaults on the Common tab

Start up the J-Link server in USB mode

If it connects to your target device it should look like this

From Eclipse launch the application using the Run/Debug Configurations..., Eclipse should upload the compiled file to the target device which looks like this

When it's running the J-Link server should look like this.

Then finally you can use Eclipse debug features to inspect variables, memory, stacktrace, set breakpoints, step over code, etc.
If Eclipse can't find your breakpoints and they are ignored then check your path mappings (if using cygwin) or use the other debugging launcher as follows. Note the 'Select other...' at the bottom of the configuration window.


