We read every piece of feedback, and take your input very seriously.
To see all available qualifiers, see our documentation.
Have a question about this project? Sign up for a free GitHub account to open an issue and contact its maintainers and the community.
By clicking “Sign up for GitHub”, you agree to our terms of service and privacy statement. We’ll occasionally send you account related emails.
Already on GitHub? Sign in to your account
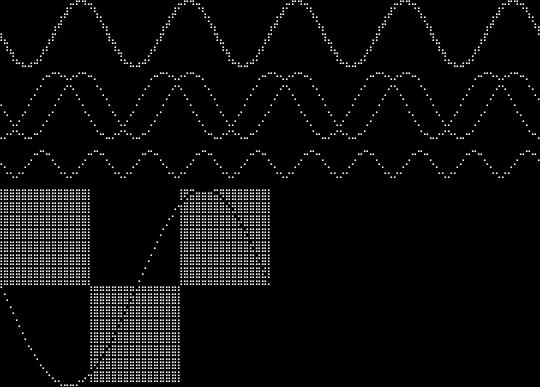
It's possible to have nice graphs in the terminal using unicode braille characters. https://github.com/asciimoo/drawille
Could be useful for:
The text was updated successfully, but these errors were encountered:
No branches or pull requests
It's possible to have nice graphs in the terminal using unicode braille characters.
https://github.com/asciimoo/drawille
Could be useful for:
The text was updated successfully, but these errors were encountered: