-
Notifications
You must be signed in to change notification settings - Fork 55
New issue
Have a question about this project? Sign up for a free GitHub account to open an issue and contact its maintainers and the community.
By clicking “Sign up for GitHub”, you agree to our terms of service and privacy statement. We’ll occasionally send you account related emails.
Already on GitHub? Sign in to your account
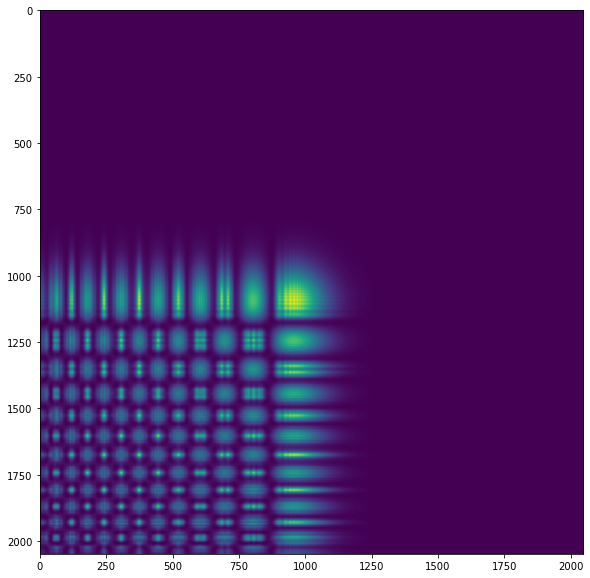
Intensity plot gets cut up when attempting to propagate finite airy beam #67
Comments
|
Hi Romutulus, I finally had the chance to look at your problem, very interesting physics these Airy beams, never heard of before!
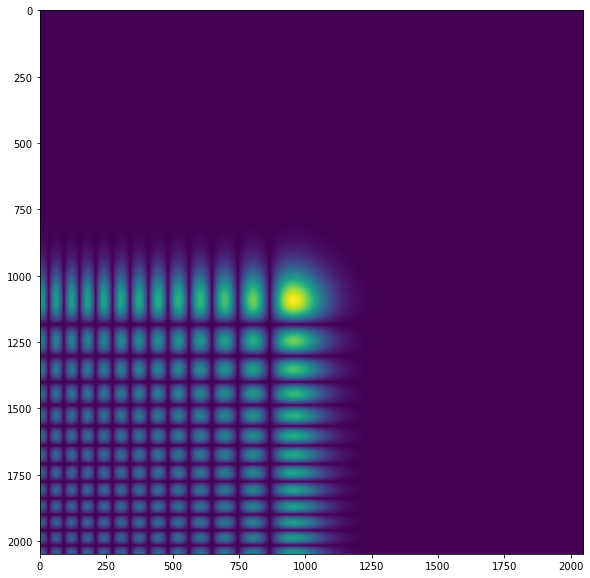
Both did not seem to influence the problem, but I found the error in a misunderstanding of the By passing After fixing this, the propagation looks alright, even though I cannot judge if it equals the physically expected result. import numpy as np
from scipy import special
import matplotlib.pyplot as plt
from LightPipes import *
wavelength = 1310*nm
size = 30.0*mm
N = 512*4
w = 0.001
a = 0.001
X1 = np.linspace(-0.015,0.015, N)
Y1 = np.linspace(-0.015,0.015, N)
def xy_fin_airy(xx,yy):
phi = special.airy(-xx/w)[0] * np.exp(a * (-xx+yy)) * special.airy(yy/w)[0]
return phi
def airy_E_old(x_space, y_space):
#NOTE in numpy, arrays are index[y, x], i.e. row major, so flipped here
e_field = np.zeros((N,N), dtype=complex)
for i in range(len(x_space)):
for k in range(len(y_space)):
e_field[i,k] = xy_fin_airy(x_space[i], y_space[k])
return e_field
def airy_E(x_space, y_space):
#speed up by vectorizing operations, numpy and scipy accept
# multi-dimensional inputs
xx, yy = np.meshgrid(x_space, y_space) #see Doc for example
e_field = xy_fin_airy(xx, yy)
#NOTE dtype of e_field is float, not complex, contains positive and negative
# real values. If scipy.special.airy would return a complex, this would
# automatically correctly be returned here
return e_field
#NOTE E_field is now flipped from original code
E = airy_E(X1,Y1)
I_sub = np.abs(E)**2 #don't forget the square, can make all the difference sometimes!
Phase_sub = np.angle(E) #phase in radians
F=Begin(size,wavelength,N)
F=SubIntensity(F, I_sub)
F=SubPhase(F, Phase_sub)
F3 = Fresnel(F,20*cm)
I3 = Intensity(0,F3)
plt.figure(figsize=(10,10))
plt.imshow(I3)PS: The image is now flipped compared to the old code, but I think this is correct since:
|
|
For the future, we should add some protection to |
|
Hi Idoyle. Thanks for helping me out. It seems to be working properly for me now (bar the shifting I mentioned earlier, but I suspect they were using the other coordinate system which scales based on propagation distance). I really do appreciate you taking the time to answer me. And yes, Airy beams do have pretty interesting physics. I find it weird that self-healing beams like these aren't really utilized to this day. |
|
Hi Romutulus and Idoyle, Below is my script: I also saw deflection of the beam. |
|
Hi FredvanGoor, Adding Airy beam to the LightPipes website would be very cool. As for finding the acceleration of the beam, yeah I realized that they do exist after doing a max check on the intensity array like you have. It was small in the microns level so adding more points definitely did help. I guess I was expecting a more visible acceleration and so did not bother to actually sift through the array for confirmation. With that said, I am actually glad that the acceleration isn't as noticeable as I expected it to be, as that would be quite problematic in an experimental setting. |
|
Hi Fred, I was also thinking about trying to replicate the results of that paper myself, but you beat me to it :) @Romutulus Instead of the trick of a Gauss beam + SLM + lens, you should also be able to insert directly your Airy formula and compare the two. Both should lead to similar shifts/"acceleration" for similar beam parameters I presume. Best, Lenny import numpy as np
from LightPipes import *
import matplotlib.pyplot as plt
'''
Generation of an Airy beam.
===========================
LightPipes for Python, Fred van Goor, 6-1-2022
A non-diffracting Airy beam can be generated by substituting a cubic phase distribution
in a laser beam. After a 2D Fourier transform with a positive lens the
Airy beam will exist.
With the parameters below, the Airy beam exists from z = 0 cm to z= 25 cm.
Ref:
G.A. Siviloglou, J. Broky, A. Dogariu and D.N. Christodoulides, PRL 99,213901(2007)
'''
#Grid definitions
wavelength = 488*nm #wavelength
size = 20*mm #grid size
N = 1024 #grid dimension
#Gaussian beam definition, relation between w0 and FWHM(Intensity) is sqrt(2ln2)
w0=1/np.sqrt(2*np.log(2)) * 6.7*mm #beam waist laser
#SLM phase modulator / cubic phase plate:
# amplitude of modulation -20..20pi over 2cm (+-1cm)
alpha = 20*np.pi
#geometrical setup:
# focal length of lens for Fourier transform to generate Airy beam
f=120*cm
# propagation distance after lens focus for Airy beam packet
z=20*cm #propagation distance
#Generate input beam
F=Begin(size,wavelength,N)
F=GaussHermite(F,w0)
Y, X = F.mgrid_cartesian #observe X Y flip
#Cubic Phase Plate (CPP):
X_slm = X/(1*cm) #scaled to size of SLM (+-1cm each direction)
Y_slm = Y/(1*cm) #to make sure alpha is applied over correct distance/scale
#this term leads to strange intensity profile in SLM plane:
#CPP=np.exp(1j*alpha*(X*X*X + Y*Y*Y)/wavelength)
#instead, this seems to work as expected:
CPP = alpha * (X_slm**3 + Y_slm**3)
CPP += np.pi #plus Pi to match colorbar in publication
F=SubPhase(F,CPP)
fig, [axl, axr] = plt.subplots(1,2, sharex=True, sharey=True)
fig.suptitle('Intensity and phase at SLM')
axl.imshow(Intensity(F), cmap='jet')
axr.imshow(Phase(F), cmap='gray')
#Fourier transform lens:
F=Lens(F,f)
F=Fresnel(F,f)
I=Intensity(F)
#Find the coordinates of the maximum intensity in focal point (start of Airy beam):
(ymax,), (xmax,) = np.where(I == np.amax(I)) #weird unpack due to return value of where()
print('X of max at z=0: [um]', X[ymax, xmax]/um)
print('Y of max at z=0: [um]', Y[ymax, xmax]/um)
fig, [axl, axr] = plt.subplots(1,2, sharex=True, sharey=True)
fig.suptitle('Intensity and phase at focal point of lens (FT of input)')
axl.imshow(Intensity(F), cmap='jet')
zoom_px = 100
axl.set_xlim(N//2-zoom_px,N//2+zoom_px)
axl.set_ylim(N//2+zoom_px,N//2-zoom_px) #observe flip
axr.imshow(Phase(F), cmap='gray')
#Propagate a distance z:
F=Fresnel(F,z)
I=Intensity(F)
#Find the coordinates of the maximum intensity:
(ymax,), (xmax,) = np.where(I == np.amax(I)) #weird unpack due to return value of where()
print('X of max at z: [um]', X[ymax, xmax]/um)
print('Y of max at z: [um]', Y[ymax, xmax]/um)
fig, [axl, axr] = plt.subplots(1,2, sharex=True, sharey=True)
fig.suptitle('Intensity and phase after {:.1f}cm propagation'.format(z/cm))
axl.imshow(Intensity(F), cmap='jet')
zoom_px = 100
axl.set_xlim(N//2-zoom_px,N//2+zoom_px)
axl.set_ylim(N//2+zoom_px,N//2-zoom_px) #observe flip
axr.imshow(Phase(F), cmap='gray') |
|
Hi Lenny and Romutulus, |
|
Hi Idolye, I agree with your statement. I will probably get to confirming that in a bit. With that said, while playing around with propagation distances, I have found visible deflection (which in my case would be in mm) with distances of meters. However, with the parameters that I have meter-scale Fresnel propagation results are a bit iffy, so I will need to check that again with the other options. Hi Fred, On the note of demonstrating self-healing, I have played around with the simple trial demonstrated by Chu et al (https://doi.org/10.1103/PhysRevA.85.013815). Here I've just added a small circular blockage at the main lobe and looked at how the beam dealt with it: Additionally, I have not tried it yet, but I think dealing with smaller magnitude but many noise would be another good example (like a noisy channel or turbulence). On another note, I did not expect to get this much conversation from a coding question haha. I'm kind of excited. I have not really been able to talk about general photonics since dropping out of my PhD program from stress exacerbated by covid. |
|
Hi, I used the paper of T. Latychevskaia, D. Schachtler, and H.W. Fink, Applied Optics Vol. 55, Issue 22, pp. 6095-6101 (2016) in the simulation below. As you can see the LightPipes results are in good agreement with their figure 2e. However their simulated and theoretical peak intensities, shown in their figure 2f, do not agree with their experiment. Below I have plotted their experimental values in the LightPipes results. I believe that these results have a better agreement with their experimental values. |


Hi. I just started playing around with LightPipes recently. I was using an arbitrary finite airy beam as a test run and it's very clear that the output gets cut up to squares or dots if I attempt to use Fresnel or Forvard (even Forward seems to be the case from a single-time use). This gets worse as I use longer propagation distances. I am wondering if I am doing something wrong on the setup. Below is my code:
Output Intensity:

Initial Intensity:

I have attempted to write Fresnel diffraction manually before trying out LightPipes, but I had problems where I had weird edge intensities that do not exist. However, I did not get my intensity cut up like shown above. Additionally, papers I've read have results showing that Airy beams would shift diagonally during propagation in spatial domain, but it doesn't seem like it is the case here. If anyone has any insight on that part, that would be great, however it might also just be me not properly understanding the theory.
The text was updated successfully, but these errors were encountered: