Introducing BIOWELL: An R package for effortlessly creating and
sharing customised surveys that include the BIO-WELL scale.
The BIO-WELL scale provides an important tool for assessing the contribution of biodiversity to human wellbeing. The scale was developed to address the limited understanding of how interactions with nature and biodiversity impact our health and wellbeing.
For more information on the BIO-WELL project and to explore our latest research and resources, please visit the official BIO-WELL website.
With the BIOWELL package, you have the flexibility to design and
analyse surveys tailored to your specific research needs.
This user-friendly package provides a range of functions that streamline the survey development process and analysis.
BIO-WELL is a reliable and validated self-report scale that links biodiversity to human wellbeing. It incorporates ecological metrics (e.g. species diversity) and multi-sensory attributes of biodiversity (e.g. smells, shapes). Five studies, involving 2962 participants, detail its development, validation, and psychometric properties (Irvine et al., 2023).
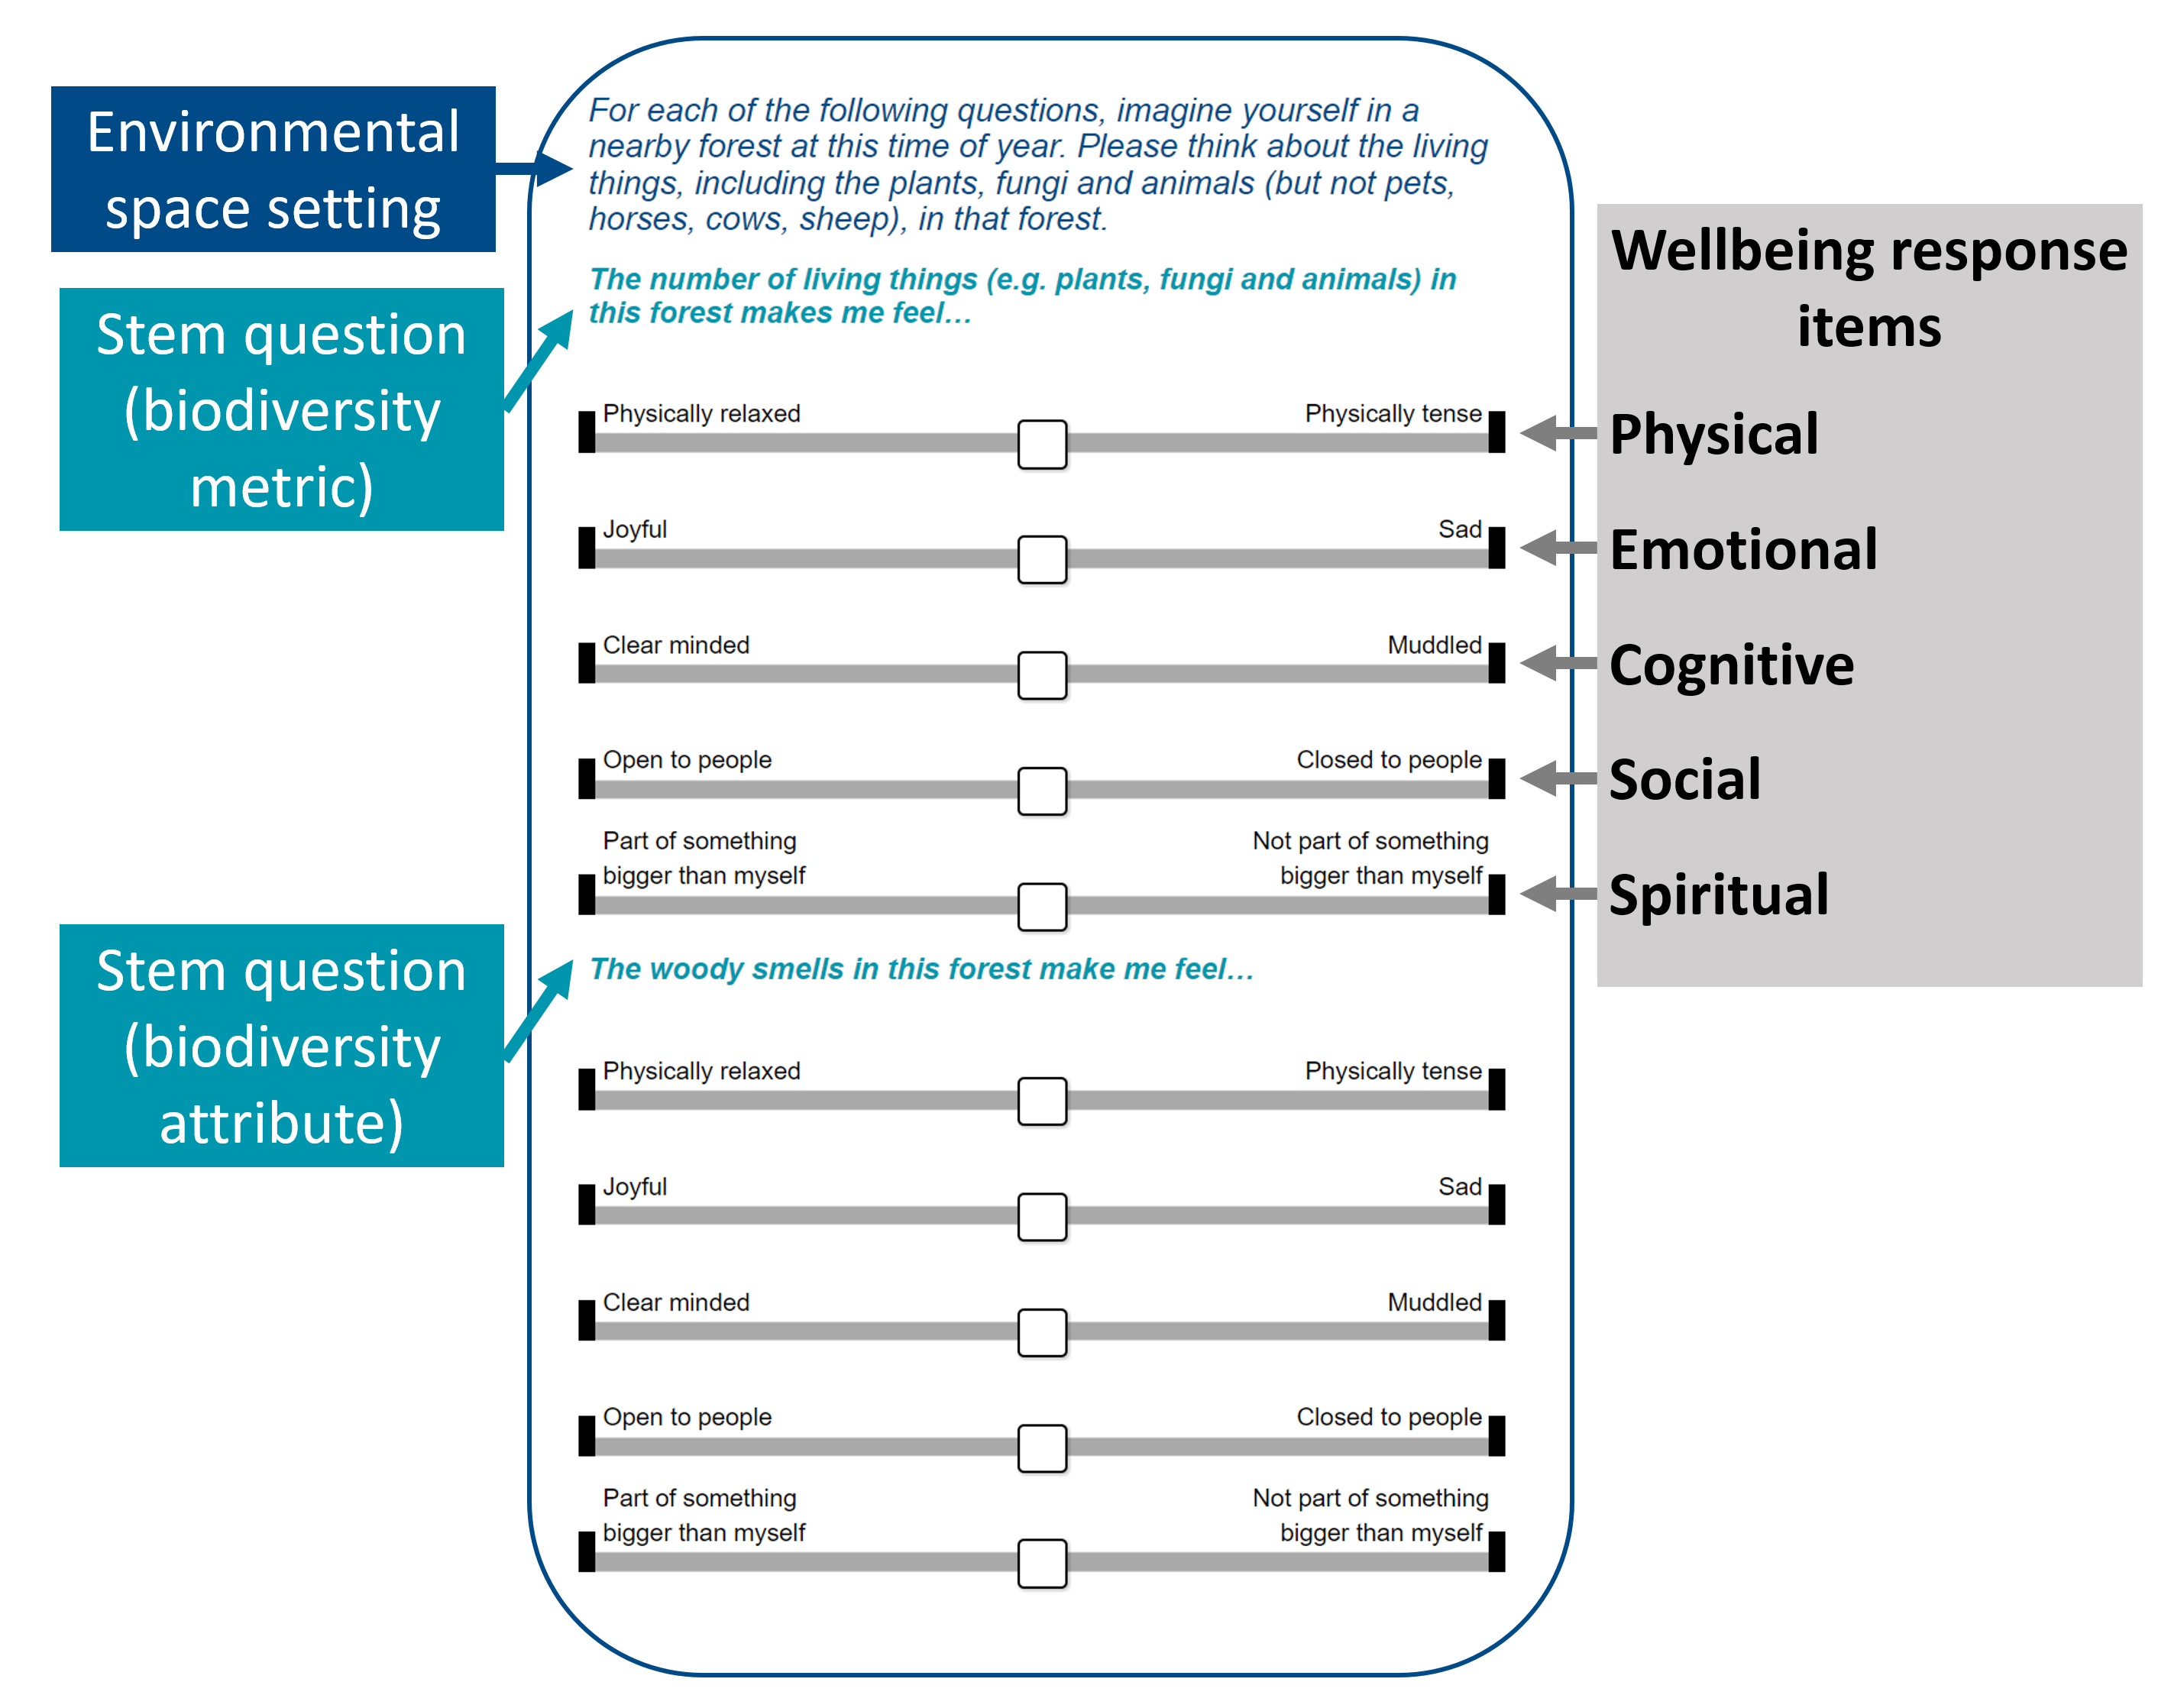
BIO-WELL provides a valuable tool for researchers and decision-makers to understand the biodiversity-health/wellbeing relationship and evaluate interventions (Fig 1).
Fig. 1. The biodiversity-wellbeing scale, BIO-WELL. Through an introductory statement, participants are invited to figuratively place themselves in a nearby woodland and to think about the biodiversity. Stem questions asked about biodiversity metrics (e.g. abundance, species diversity), as well as biodiversity attributes (e.g. smells, colours, shapes). Wellbeing response items reflected either physical, emotional, cognitive, social or spiritual wellbeing, following a biopsychosocial-spiritual model of health. They are in Visual Analogue Scale format, with a positive and negative linguistic anchor either side of a slider ranging from 0 to 100, allowing participants to indicate their wellbeing along the line. Two of the seventeen biodiversity stem questions are included here for illustrative purposes.
Read more about the development and application of BIO-WELL in:
-
Combines measures of the environment and wellbeing into a single scale.
-
Includes stem questions that specifically ask participants to consider their wellbeing in relation to different elements of biodiversity, such as species diversity, ecological processes, and attributes like sounds.
-
Captures the holistic experience of biodiversity using a biopsychosocial-spiritual model of wellbeing, including physical, emotional, cognitive, social, and spiritual domains of wellbeing and a response format that can capture the wellbeing continuum from negative to positive.
-
Applicable to diverse research settings, including scenario-based studies, in situ evaluations, and studies that incorporate measures of actual and perceived biodiversity.
-
The scale’s qualitative underpinning and strong psychometric properties make it a reliable and valid instrument.
-
It has been developed with input from the target population and minimizes participant burden by using a small number of response items.
-
Customisation: Adapt the scale to diverse research settings and environments. Whether you’re studying woodlands, wetlands, urban parks, or other ecological contexts, the
BIOWELLpackage allows for easy modification of stem questions and attributes to suit the specific environment under investigation. -
Validity and Reliability: Leverage the strength of the BIO-WELL scale, which has undergone rigorous validation and psychometric evaluation in previous studies. Benefit from a robust measurement tool that ensures the quality of data collected through your custom surveys.
-
Seamless Integration: The
BIOWELLpackage integrates the R statistical programming environment, offering a familiar platform for survey design and analysis.-
Upload your BIO-WELL surveys to the free Shiny Server for sharing surveys via URL.
-
Utilises free cloud storage on Dropbox for survey response data.
-
Take advantage of R’s extensive packages to analyse your survey response data.
-
-
Documentation: The package comes with comprehensive documentation, including Vignette tutorials and function examples, to assist you in utilising the
BIOWELLpackage to its full potential.
Install the BIOWELL package by running the line below!
devtools::install_github("r-a-dobson/BIO-WELL")There are five stages in the BIOWELL package framework (Fig 2). The functions available for each stages are described in the package’s five vignettes.
Fig. 2. The BIOWELL package framework.
- Activate Dropbox - set-up cloud storage for survey response data
with function
activate_dropbox().
-
Build survey - develop your custom BIO-WELL survey from start to finish with
build_survey(). -
Create URL - upload your survey to the Shiny Servers and obtain survey access link to share with participants with
create_URL(). -
Download data - download and combine responses from survey participants into R with
download_data(). -
Evaluate survey and explore patterns - calculate key statistics including Cronbach’s Alpha and Item-Total with
evaluate_survey()and then generate plots of BIO-WELL scores across environments and stem questions withexplore_data().
For more details, see the package manual here for more details on each function.
Try our package vignettes that guide you through the stages from building custom BIO-WELL surveys to analysing survey response data!
If you encounter an error or bug when installing and using BIOWELL, please post a comment here for guidance and support from us.


