-
Notifications
You must be signed in to change notification settings - Fork 141
Part 1: crude 3D renderings
So, I start with a bare C++ compiler, nothing else. I break the code into steps; as in my previous articles on graphics, I adhere to the rule "one step = one commit". Github offers a very nice way to highlight changes made with every commit.
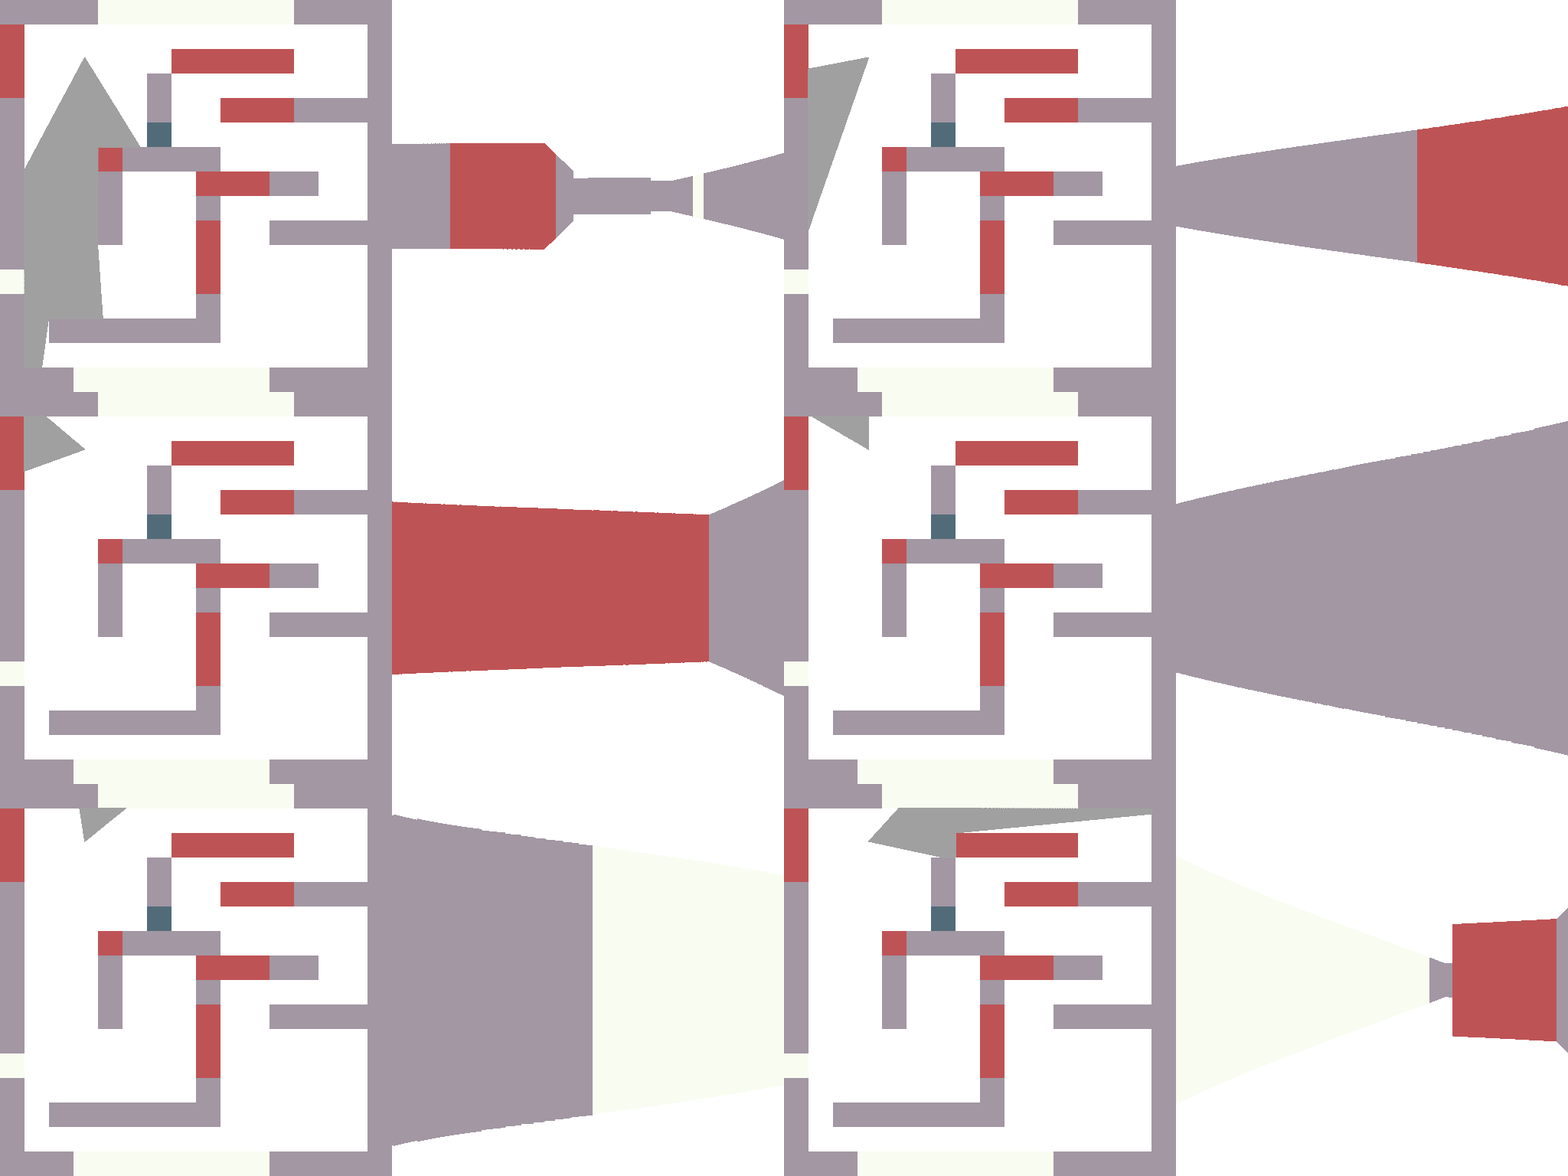
Okay, here we go. We're still a long way from the GUI, so first we'll just save pictures to disk. Altogether, we need to be able to store an image in the computer's memory and save it to disk in a standard format. I want to get a file like this one:
The full C++ code for this step is available in this commit, it is short, so let us list it here:
#include <iostream>
#include <fstream>
#include <vector>
#include <cstdint>
#include <cassert>

uint32_t pack_color(const uint8_t r, const uint8_t g, const uint8_t b, const uint8_t a=255) {
    return (a<<24) + (b<<16) + (g<<8) + r;
}

void unpack_color(const uint32_t &color, uint8_t &r, uint8_t &g, uint8_t &b, uint8_t &a) {
    r = (color >>  0) & 255;
    g = (color >>  8) & 255;
    b = (color >> 16) & 255;
    a = (color >> 24) & 255;
}

void drop_ppm_image(const std::string filename, const std::vector<uint32_t> &image, const size_t w, const size_t h) {
    assert(image.size() == w*h);
    std::ofstream ofs(filename);
    ofs << "P6\n" << w << " " << h << "\n255\n";
    for (size_t i = 0; i < h*w; ++i) {
        uint8_t r, g, b, a;
        unpack_color(image[i], r, g, b, a);
        ofs << static_cast<char>(r) << static_cast<char>(g) << static_cast<char>(b);
    }
    ofs.close();
}

int main() {
    const size_t win_w = 512; // image width
    const size_t win_h = 512; // image height
    std::vector<uint32_t> framebuffer(win_w*win_h, 255); // the image itself, initialized to red

    for (size_t j = 0; j<win_h; j++) { // fill the screen with color gradients
        for (size_t i = 0; i<win_w; i++) {
            uint8_t r = 255*j/float(win_h); // varies between 0 and 255 as j sweeps the vertical
            uint8_t g = 255*i/float(win_w); // varies between 0 and 255 as i sweeps the horizontal
            uint8_t b = 0;
            framebuffer[i+j*win_w] = pack_color(r, g, b);
        }
    }

    drop_ppm_image("./out.ppm", framebuffer, win_w, win_h);

    return 0;
}
If you don't have a compiler on your computer, it's not a problem. If you have a guithub account, you can view, edit and run the code (sic!) in one click in your browser.
When you open this link, gitpod creates a virtual machine for you, launches VS Code, and opens a terminal on the remote machine. In the command history (click on the console and press the up key) there is a complete set of commands that allows you to compile the code, launch it and open the resulting image.
So, what do you need to understand in this code? First, I store colors in a four-byte integer type uint32_t. Each byte represents a component R, G, B or A. The pack_color() and unpack_color() functions allow you to work with color channels.
Next, I store a two-dimensional picture in a normal one-dimensional array. To acces a pixel with coordinates (x,y) I don't write image[x][y], but I write image[x + y*width]. If this way of packing two-dimensional information into a one-dimensional array is new for you, you need to take a pencil right now to make this perfectly clear, because the project is full of such things. For me personally, this calculation does not even reach the brain, it is processed directly in the spinal cord.
Finally a dooble loop sweeps the picture and fills it with a color gradient. The image is dropped to the disk in .ppm file format.
We need a map of our world. At this step I just want to define the data structure and draw a map on the screen. That's how should look like:

You can see the modifications here. It is very simple: I have hardcoded the map into a one-dimensional array, defined a draw_rectangle function, and have drawn every non-empty cell of the map.
I remind you that this button will let you run the code right at this step:
What do we need to be able to draw a player on a map? GPS coordinates suffice :)
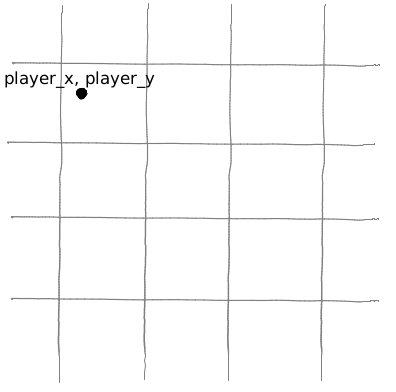
We add two variables x and y, and then draw the player in the map:

You can see the modifications here. I won't remind you about gitpod :)
In addition to the player's coordinates, it would be nice to know in which direction he is looking. So let's add `player_a` variable, it gives the direction of the player's gaze (the angle between the view direction and the x axis):
Now I want a point to slide along the orange ray. How to do it? Look at the green triangle. We know that cos(player_a) = a/c, and sin(player_a) = b/c.
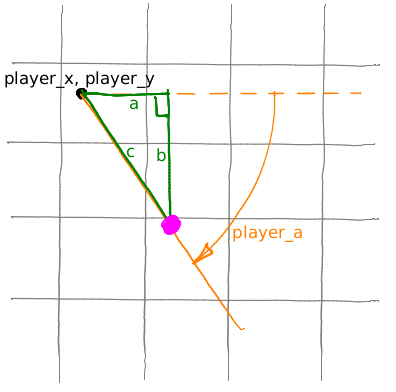
Now let us take an arbitrary (positive) value c and then compute x = player_x + c*cos(player_a) and y = player_y + c*sin(player_a). Obviously, it will give us the magenta point; if we vary the parameter c from 0 to +infinity, the magenta point would slide along the orange ray. Moreover, c is the distance from the point (x,y) to the point (player_x, player_y)!
The heart of our 3D engine is this loop:
   float c = 0;
    for (; c<20; c+=.05) {
        float x = player_x + c*cos(player_a);
        float y = player_y + c*sin(player_a);
        if (map[int(x)+int(y)*map_w]!=' ') break;
   }
We make the point (x,y) slide along the ray, if it hits an obstacle, we break the loop, and the variable c gives us the distance to the obstacle!
Мы двигаем точку (x,y) вдоль луча, если она натыкается на препятствие на карте, то прерываем цикл, и переменная c даёт расстояние до препятствия! Exactly like a laser rangefinder.

You can see the modifications here.
Один луч это прекрасно, но всё же наши глаза видят целый сектор. Давайте назовём угол обзора fov (field of view):
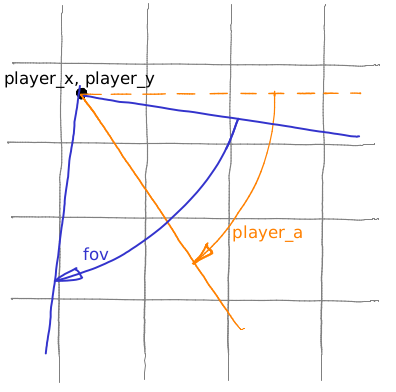
И выпустим 512 лучей (кстати, почему 512?), плавно заметая весь сектор обзора:
 Внесённые изменения можно посмотреть тут.
А теперь ключевой момент. Для каждого из 512 лучей мы получили расстояние до ближайшего препятствия, так? А теперь давайте сделаем вторую картинку шириной (спойлер) 512 пикселей; в которой мы для каждого луча будем рисовать один вертикальный отрезок, причём высота отрезка обратно пропорциональна расстоянию до препятствия:

Ещё раз, это ключевой момент создания иллюзии 3Д, убедитесь, что вы понимаете, о чём идёт речь. Рисуя вертикальные отрезки, по факту, мы рисуем частокол, где высота каждого кола тем меньше, чем дальше он от нас находится:

Внесённые изменения можно посмотреть тут.
На этом этапе мы впервые рисуем что-то динамическое (я просто скидываю на диск 360 картинок). Всё тривиально: я изменяю player_a, отрисовываю картинку, сохраняю, изменяю player_a, отрисовываю, сохраняю. Чтобы было чуть веселее, я каждому типу клетки в нашей карте присвоил случайное значение цвета.
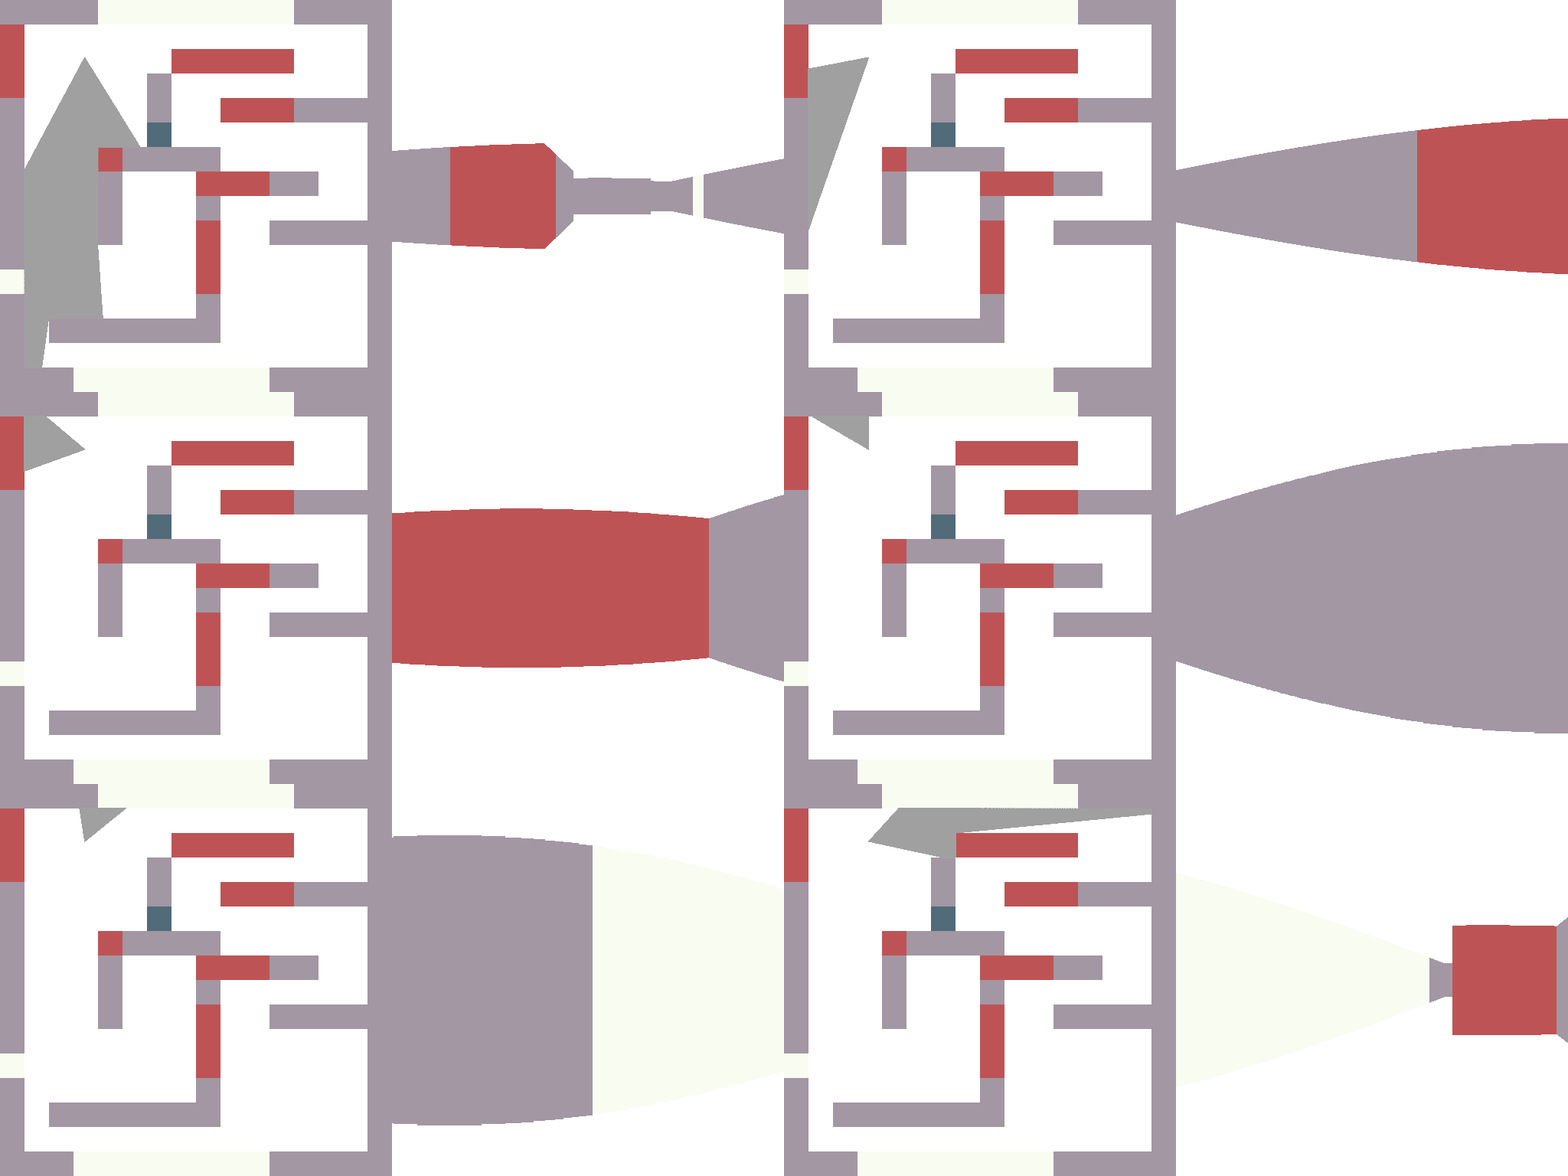 Внесённые изменения можно посмотреть тут.
Вы обратили внимание, какой отличный эффект "рыбьего глаза" у нас получается, когда мы смотрим на стенку вблизи? Примерно вот так оно выглядит:
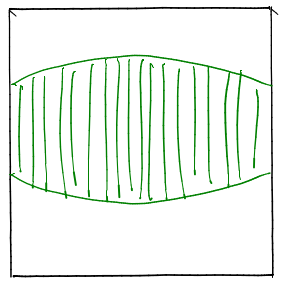
Почему? Да очень просто. Вот мы смотрим на стенку:
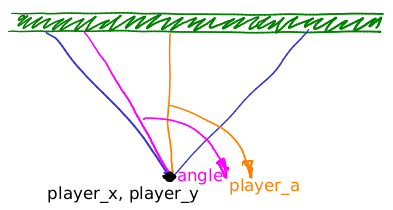
Для отрисовки нашей стены мы заметаем фиолетовым лучом наш синий сектор обзора. Возьмём конкретное значение направления луча, как на этой картинке. Длина оранжевого отрезка явно меньше длины фиолетового. Поскольку для определения высоты каждого вертикального отрезка, что мы рисуем на экране, мы делим на расстояние до преграды, рыбий глаз вполне закономерен.
Скорректировать это искажение совсем несложно, посмотрите, как это делается. Пожалуйста, убедитесь, что вы понимаете, откуда там взялся косинус. Нарисовать схему на листочке сильно помогает.
