A proxy is not the simplest component to test because it requires both a client and a server, and the whole behavior and observed performance are in fact those of the whole chain from the client, its operating system, the network, the proxy's operating system, the proxy, the network to the server, the server's operating system and finaly the server itself. All these elements require great care and will often not work in optimal conditions by default. Sometimes a simple reboot or down/up cycle on an interface can be enough to cause the loss of some fine settings that managed to stabilize the platform.
As it is very difficult to figure where the limits are, it is highly recommended to use two clients and two servers:

This way it becomes possible to observe the effect of adding or removing one of each, and to compare them:
- if one chain works well and the other works poorly, it can help figure a cause at the system or network level ;
- if the load reached using two clients and two servers isn't significantly higher than the load reached with only one of each, it is often reasonable to assume that the tested component becomes the limiting factor ;
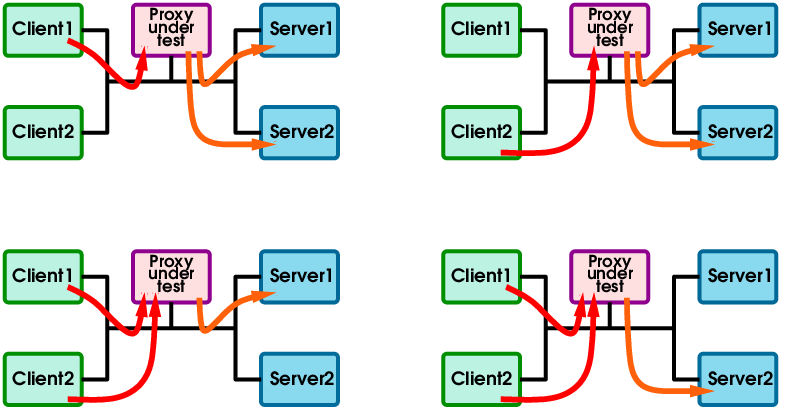
Given that HTTP traffic is highly asymmetric, it often makes sense to place both the clients and the servers on the same machines, and make full use of the network.

Then testing the connectivity requires to cross the traffic between client1 and server2, and client2 and server1:

For small setups this can also be done with a single machine, but then it is impossible to validate the network, as all the traffic between the client and the server will remain inside the test machine. This can be fine once the platform is trusted though, especially for developers who want to periodically test the effect of their changes.
In modern architectures, proxies are installed at many layers, and they can be crossed multiple times for a single end-user request. As such their latency becomes an important factor and must be measured. And due to the number of flows passing through a proxy in service mesh environments and the amplification factor applied to its latency, measuring the tail latencies (e.g. 99.9995% and more) becomes even more important. Indeed, if a single end-user request induces 10 requests through the proxy, a bad latency every 10000 request will affect 1/1000 of user requests. If each page contains 100 requests, it can result in 1/10 of users having a bad experience.
While most tools will provide various metrics such as connect time, time-to-first-byte, total time, each with minimum, maximum, average, mean, standard deviation or even percentiles, the issue is that these ones must not be measured on the load generation tools when these tools are driven at high rates. Indeed, this measurement includes the whole chain again, and will include the queuing of requests in the client's network stack, and the queueing of returned responses in the server's stack, both of which can vary a lot under load.
The ideal way to proceed is to have an extra load generator and server working at a much smaller load, typically 1%, collecting these metrics. This is the fairest way to measure the impact on user experience of a device under load because this will almost only include the device itself. It is not always easy nor possible to add such an extra machine running at low load, because it may require some configuration on the proxy, or because the architecture doesn't easily allow to add components. The only solution in this case is to measure the response time between the client and the server at the same loads and to superimpose the graphs so that it becomes possible to verify what is the reference and what extra delay is attributed to the insertion of the proxy.

Measuring a proxy's latency requires to place it in the same condition as its targetted environment. First, the latency is only meaningful at the target load (though it may indicate how the conditions may degrade during an unexpected event). Indeed, the latency measured at maximum load suffers a queuing effect and will in fact measure the sum of all queued operations that get delayed due to limited processing capacity. Second, the target architecture needs to be matched. If the component is planned to be set up as a reverse proxy in front of the server, it probably needs to have its own machine, and must be tested this way, where latency measurements will include the operating system and hardware. If it's planned to be installed as a side car, it may need to be placed on a dedicated machine along with the application, possibly modelled via another reference proxy. As this becomes more difficult to set up, it's often better to install the proxy either directly on the server if it plans to mostly receive requests from the external world to the server, or to place it on the client if it plans to mostly receive outgoing requests from a local application. However, such setups become particularly difficult to measure because of the required coexistence of the component being tested with stress-test tools that possibly behave much differently than an application at the operating system level. They may for example require more threads or require different operating system tuning than the target, and significantly affect the measurement.
The problem with tail latencies is that they're almost always wrong in test environments. Some of the causes include:
-
ARP resolution: this is the most common cause. The machines are idle before starting the test, the caches are cleared, and starting the very first requests already requires an ARP round-trip that doesn't always work that fast. And if the first 100 requests are affected by a 20ms extra response time, after one million requests, these 20ms will still represent 1/10000 of the traffic, hence affect percentiles 99.99% and above. A nice approach to avoid this is the "false-start" approach. Pre-heating the whole chain's caches by starting the traffic, stopping it and starting again is often easy enough for manually run the tests. A much better approach consists in taking the measures after the pre-heating is complete (some tools can do this).
-
running tools: collecting CPU usage, socket counts, network bandwidth and various other metrics will occasionally cause some short scheduling delays that are observable in the tail of the percentile. While it's often possible to isolate these tools on dedicated CPUs, their effet can hardly be eliminated but will be significantly lowered by carefully choosing the tools. For example, counting connections using "netstat" is totally frowned upon as it can keep the CPU busy for several seconds and place long locks in the network stack. Connecting over SSH during the test is not acceptable either due to the CPU time taken by the session key generation. Transferring collected data in batches and stealing bandwidth and CPU is not possible either. A common issue happens when running tests on a developers' PC, while a browser or an IDE remains present behind and consumes 10-15% of the CPU, or the system decides to upgrade packages. This completely disqualifies the test, obviously.
If a perturbation is extremely regular, such as
crondchecking entries every 60 seconds, it might be observable on graphs and is easier to justify (though stopping the disturbing service would be preferable). It may be required in such a case to drop the tail of the percentile past a certain point, but it must be mentioned in the report (e.g. "percentile cut at 99.995% due to measurement artefacts").
-
memory allocation: lots of tools, proxies and even network stacks will recycle their objects. But during the ramp up, some memory allocations will be required and these ones can be particularly slow and cause incorrect values that will not be observed in production. In this case again, starting to measure the percentiles at the end of the ramp-up is the right way to proceed, otherwise a part of the tail will need to be dropped. It is easy to test for such a case however, because doubling the test duration should result in halving the length of the tail. Note that this also affects operating systems, and load generation tools need to specifically take care of this, e.g. by pre-allocating resources or by starting measurements only once everything is stabilized.

-
inter-thread issues while stopping: threaded load generation tools can face difficulties smoothly stopping the traffic at the end of the test: some threads may exit and cause perturbations when releasing their resources at the end while other threads are just finishing the last measures. This is often visible with high latency peaks at the end. One option might be to drop the last few seconds from collected measures, but it's not always an option when the tools compute percentiles themselves. There again triming the tail and indicating it can be an option.

-
CPU migrations: the tested device may be experiencing migrations between certain CPU cores, but this may also happen on the load generation tools themselves. In order to avoid this it might be necessary to force all tools to use certain CPUs only. This is particularly frequent at high loads when the network threads take too much CPU and force some userland tools to migrate to other cores. The effect will be that latencies will vary between several discrete levels, sometimes surrounded by a peak during the migration.

-
swapping: all the machines involved need to be periodically checked for never swapping at all. This often happens with clients when passed a wrong argument by accident, such as too many source addresses, or too many concurrent users, where they start to use huge amounts of RAM and degrade the performance and their own measurements. While this is far from being the first cause anyone thinks about, it is easily addressed once detected though.
-
disk accesses: disk accesses cause extreme latency spikes and are often only caused by the test conditions. For example, in production it is planned to send the logs to a central log server but during the test it was considered acceptable to send them to a local file. But this file gets periodically flushed and can incur tens of milliseconds of latency once in a while. Sending them to a local process is not better, as this process can become a source of trouble by itself, or even trigger rotation or compression. If the server contains a cache, it must be verified that it doesn't periodically scan its objects and slow down the whole chain. Additionally it's not uncommon to enable packet captures to troubleshoot an issue, and these ones are great source of disk accesses as well. All disk activity must be eliminated. If some file access are unavoidable for some of the tools or for some of the components due to the test condition, at least they must be performed in a RAM disk, which will significantly reduce the effect on latency.
-
network saturation: when running large objects tests, it becomes very easy to saturate the network link, especially with links of 10 GbE or less. When the network saturates, packets are dropped and TCP retransmits happen. These ones will cause huge delays that are immediately visible in latency measurements, sometimes showing bad values above 99%, while the traffic will hit a wall and remain smooth. The latency will grow exponentially with the load past the saturation point. This is one good reason for always monitoring the traffic level and make sure this does not happen. Note that depending on the measurement frequency, an network bandwidth reaching 90% averaged over 5 seconds can be enough to indicate periodic saturation and losses. Collecting and graphing network retransmits is important if such a risk is identified.


Overall a good approach is to let a light activity measurement tool like vmstat 1 run on each machine involved, and to watch for irregularities during the test. Interrupt counts going very high or very low, system CPU time making jumps, variations in the run queue, swap in/out, blocks in/out are very good indicators of unexpected activity and something having to be fixed. Pauses in the activity very commonly indicate network issues.
A number of elements above show that benchmark conditions are particularly tricky and never optimal in practice. But usually it is not a problem provided that the level of trust of the result matches the conditions. For example, "a quick test run on my PC" is a perfectly valid condition to show the effect of a new algorithm that is supposed to change a metric by an order of magnitude. However reporting percentiles past 99% might become problematic if the environment was not completely checked for the absence of noisy neighbors. In any case, there's no excuse for not letting "vmstat" run in another window.
Most people running tests on a daily basis do not recheck the elements above for each test as these take way too much time. But they run in a constant and well-known environment within limits where they know their tools perform adequately, and are used to a few very simple tests which are supposed to show well-known values indicating that the platform is "trustable enough". And very frequently they get hit by a bad setting, an undesired kernel module that was loaded by accident, a parasitic runaway process or any such thing. But as tests are important to improve software quality, many users still find it preferable to waste some time once in a while chasing a false problem than never to run any test by lack of time. What is important however is never to forget about completely revalidating the whole platform before producing tests to be published.
Being able to quickly produce a graph to control the validity of a test is crucial. Most testers got hit a few times by discovering bad patterns in their graphs after being away from the test platform. Tools should report live measurements to visually control that everything looks OK, and at the end of the test, no more than a few seconds should be needed to automatically produce all graphs so that a quick glance is enough to confirm the tests went fine. Without such facilities, the lazy approach will imply that such controls will not be made and that the tests cannot be trusted, or will take a lot of time. Making sure to be able to automate the production of graphs out of the suite is a time saver and very good investment even for a single day of testing sessions. The example below taken from a real test shows throughput varying by 50% and latency being multiplied by 3. This was caused by incorrect system settings and would defintiely not have been observed without live measurements.

Graphing latency is extremely important. When things go wrong, some patterns will indeed appear:
- points around multiples of 4 ms usually indicate some CPU time being shared with a parasitic process on one of the machine
- points around multiples of 200ms or 3s indicate some network losses
- important variations during the tests generally indicate some queueing at various stages in the network stack caused by a saturated device
However, with high request rates, the graphed latencies will very likely be averaged (while the maximums would be more relevant). So while an unstable graph proves a problem, a stable graph doesn't prove anything. This is why percentiles should be graphed as well if the tools involved provide them.
Graphing the request rate usually shows if something is going wrong with the CPU usage. When the component is CPU-bound, the request rate should theorically be very flat. But in practice if parasitic background processes use the CPU, or if network drops cause excess work in the network stack, some visible variations will appear.
Graphing the network bandwidth is important for large objects, because it must always be flat when the network is saturated. If it is not, again, it definitely indicates some problems in the setup. Common causes include improperly bound network interrupts randomly saturating one CPU, virtualized interfaces, NAT, and hardware-level issues (such as a broken fiber or a low-grade twisted-pair cable used at 10Gbps). Note that there are many network drivers which use a timer to collect hardware statistics, and that using a period which is not an integral multiple of this timer causes variations. For example, if a network driver collects its stats every 3 seconds and the graphs points are collected every 5 seconds, the first measurement will be 66% off, the second 33% up, and the third one will be correct. This is quickly detected in graphs and live monitoring and must be addressed.
One nice benefit of monitoring numbers as the test is running is that it allows to abort a faulty test and start again as soon as something wrong is detected. While reading numbers on a screen is often the simplest and most accessible approach, being able to follow live graphs is even better.
A common difficulty that arises when starting to produce graphs is to properly align the different metrics from different tools or machines. There is no perfect approach here. Some people just try to start everything at the same time and to manually correct time offsets. Others prefer to synchronize all the chain using NTP, and to produce statistics with an absolute time that is later used as a start offset. In addition to this, a number of tools do not report the current time, and it is often assumed that if a line is produced every second, the line count is sufficient to serve as a relative date. But this does not include time drifts, and can start to cause a visible stretch over a few minutes. One easy approach consists in sending the output of such tools through a filter that adds the current date at the beginning of each line, in order to correct for the drift. It may however happen that two consecutive lines show the same time and cause artefacts in the output, for example when aggregating the values from multiple machines. In order to avoid this, a general rule is that the various rates need to appear in the output, and not to make the graphing tools compute them from multiple lines. This way, averages over one second are graphed and if there are holes or duplicates due to time rounding, it does not cause representation issues.
In general it is best to collect certain metrics at a central place instead of having to aggregate them over multiple nodes. But there is not always the choice. For example, measuring the network in and out bandwidths on a proxy if it uses a single interface is not really possible, and in this case the sum of the clients's received traffic or of the server's sent traffic will need to be used. If measurements contain a few rare holes (a missing second from time to time), with stable metrics it can be fine to duplicate a line to fill the hole and ease time-based aggregation. Similarly a duplicate entry can be arbitrarily dropped. But this only works for rates, not for counters. If there are too many holes (tens of them in a session), a better approach consists in graphing all nodes separately and let the user visually compute the sum of the curves.
While it is often trivial to test a component at its maximum performance level, it is much harder to test it below this level. But this is important because the deployment will usually be done following a safety margin, and in general, operations people do not want to see any of their components work for extended periods of time beyond 80% of their capacity.
It turns out that while the choice of tool significantly reduces when trying to limit the traffic, it saves a lot of analysis time because the results are much cleaner, and the measures much less sensitive to environment perturbations. If a component works fine with 80% of the CPU usage, this leaves enough CPU available to deal with measurement tools, network retransmits and other occasional acitivities without substantially perturbating the tested component. The various queues and socket buffers across the whole network stack will not be filled with excessively long chains causing retransmits, and the output graphs tend to look good with a very high success rate. Overall, such approach is more accurate regarding the target use case (especially when it comes to latency measurements), and is the one which delivers the most reproductible measurements, to the point where they can easily be automated.
There is no exact rule around the way to proceed, but usually the approach consists in first checking for the component's apparent maximum capacity, and second reducing it to roughly 50-80% while still keeping round numbers and testing at such a level. For example if a component shows a maximum capacity oscillating between 160000 and 165000 requests per second, 80% will give 128000 to 132000, so fixing a plateau at 130000 in 10000 increments seems like this can provide an easily analysable report. If at 80% of its capacity it remains at more than 80% CPU usage, it can be worth going much lower, such as 50% until a very stable point is figured. Response times will usually fall faster than the performance, and for all users seeking very low latency it is important to keep this principle in mind.
Sometimes the choice of tools is limited due to a specific protocol that has to be used, to the choice of a special tool that eases the production of a report, or due to an internal choice dictated by the fact that a company is paying a licence for a specific test product. And it can happen that such tools are not sufficient to saturate the component to be tested. Fortunately, while proxies cause lots of difficulties in tests, this is an area where they are convenient.
A good solution consists in chaining the proxy multiple times over itself. For example, in order to multiply its outer load by 10, it ought to be listening on 10 ports (or addresses) all daisy-chained, with the first one being used by the client and the last one going to the server. This will definitely not accurately reproduce the same observations as the machine being hit by 10 times the load, but it will at least provide some good confidence in what the component alone is capable of, and will show how several of them compare to each other. This is definitely something useful for developers who want to magnify the effect of their code changes without requiring a large setup. This only works when the same protocols can be used all along the chain and when the component to be tested is supposed to perform equally at various stages. This should not be used to publish reports though.