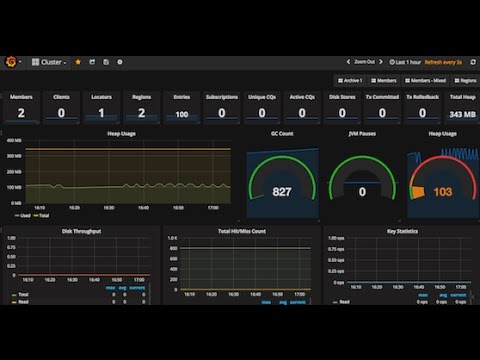
jmx-to-grafana feeds Geode MBeans metrics data into time-series databases (such as InfluxDB). Later is used in turn to
feed the Grafana dashboards. Grafana allows to build comprehensive dashboards.
The Geode JMX Grafana Dashboard Video illustrates the approach. It shows how to deploy and start the jmx-to-grafana
and how to build Grafana dashboards using the geode jmx feed.
Get the source code from github
git clone https://github.com/tzolov/geode-dashboard.git
From within the geode-dashboard/jmx-to-grafana directory run
mvn clean install
Build Grafana dashboard to plot real-time metrics of Geode cluster. Grafana and InfluxDB have to be installed first.
The jmx-to-grafana reads every minute (cronExpression="0 0/1 * * * ?") the JMX metrics from
Geode MBean Server (http://localhost:1099) and loads them into InfluxDB database (GeodeJmx). The InfluxDB is
running at http://localhost:8086.
The Grafana server (http://localhost:3000) uses the GeodeJmx time-series database to plot various Real-Time dashboards
java -jar ./target/jmx-to-grafana-0.0.2-SNAPSHOT.jar \
   --mbeanHostName=localhost \
   --mbeanPort=1099 \
   --influxUrl=http://localhost:8086 \
   --influxDatabaseName=GeodeJmx \
   --cronExpression="0 0/1 * * * ?"
| Property Name | Default Value | Description |
|---|---|---|
| influxUrl | http://localhost:8086 | InfulxDB connection URL |
| influxUser | admin | InfuxDB connection username |
| influxPassword | admin | InfluxDB connection password |
| cleanDatabaseOnLoad | false | If set the target TSDB will be (re)created on every statistics load |
| influxRetentionPolicy | autogen | InfluxDB retention policy |
| mbeanHostName | None | |
| influxDatabaseName | GeodeJmx | Database to load the jmx metrics into. Same database is used to load metrics for cluster members. The member is used to distinct the time-series form different members. |
| mbeanPort | 1099 | |
| cronExpression | 0 0/1 * * * ? | Time interval for pulling JMX metrics from Geode and load them into InfluxDB. Defaults to 1m. Use --cronExpression="..." syntax to set the expression from the command line. |
| Geode MBean | InfluxDB Measurement | InfluxDB Meta-tags | Description |
|---|---|---|---|
| DistributedSystemMXBean | DistributedSystem | none | System-wide aggregate MBean that provides a high-level view of the entire distributed system including all members (cache servers, peers, locators) and their caches. At any given point of time, it can provide a snapshot of the complete distributed system and its operations. |
| DistributedRegionMXBean | DistributedRegion | region | System-wide aggregate MBean of a named region. It provides a high-level view of a region for all members hosting and/or using that region. For example, you can obtain a list of all members that are hosting the region. Some methods are only available for partitioned regions. |
| MemberMXBean | Member | member | Member’s local view of its connection and cache. It is the primary gateway to manage a particular member. It exposes member level attributes and statistics. |
| Consult the Geode JMX MBeans for the full list of available Geode MBeans. |
Note: Use Grafana Templating to define query variables for the
memberadnregionmeta-tags (e.g.show tag values with key="member"orshow tag values with key="region"). This allow mix and match measurments from different cluster members or multiple regions.
The jmx-to-grafana reconfigures the feeds automatically on following Geode events:
- New Member is added or removed form the cluster:
gemfire.distributedsystem.cache.member.departed,gemfire.distributedsystem.cache.member.joined. - New Regions is created for removed:
gemfire.distributedsystem.cache.region.created,gemfire.distributedsystem.cache.region.closed
Explore the Predefined Dashboards for more comprehensive dashboards panels.
Use or customize the sample Geode Grafana Dashboards to visualize Cluster, Members or Regions view of the distributed system.


