Node-RED flow to display the status of remote devices on the dashboard using ui-table
first beta version
In IOT or home automation environments there are normally many remote devices connected to Node-RED sometimes over wireless connections. This flow gives a dynamic overview of all devices with their last status messages and system health information.
- expandable
- all kinds of data sources can be added using translators
- data can be processed through plugins
- table layout and functions can be configured
- easy to modify
- no custom nodes which makes it difficult for normal users to do modifications
- standard nodes wherever possible and useful
- reusable
- function nodes should be reusable and easy to read
- configuration through json objects instead if/switch statements
- subflows with environment variables when a function node is more "complex"
- dynamic dashboard table
- make use of the functionality of ui-table and the tabulator js module behind
- only send updated data to keep traffic low
- let ui-table do the display formatting so the flow only holds generic data and the screen display can be individually configured
- contributions are highly appreciated
- new translation nodes for different devices or protocols
- new or updated data processing plugins nodes
- new or updated table designs
- many parts of the flow contains only a draft layout and basic functions suggestions or PRs are always welcome.
- documentation
- documentation in the nodes description tab so it is always available
- documentation in source comments if useful
- copy/paste documentation in the repro
- keep the docs up to date
- no database necessary
- to make it easy to inspect all data it is hold in Node-RED context
- keep data as close as possible to the node (context.set instead of flow.set, no global.set)
- don't rely on data of other nodes as they could be "unplugged" or not available
- make use of the basic properties defined by the homie convention
- as the flow is mostly dealing with live data use non volatile file memory only when useful (i.e. table edits or interactive layout modifications)
- it is not expected that the flow is producing a huge amount of data. But many updates will occur, so quick access is the key.
-
table population
The table is filled and updated dynamically as data arrives. Only new or updated data is sent to the client
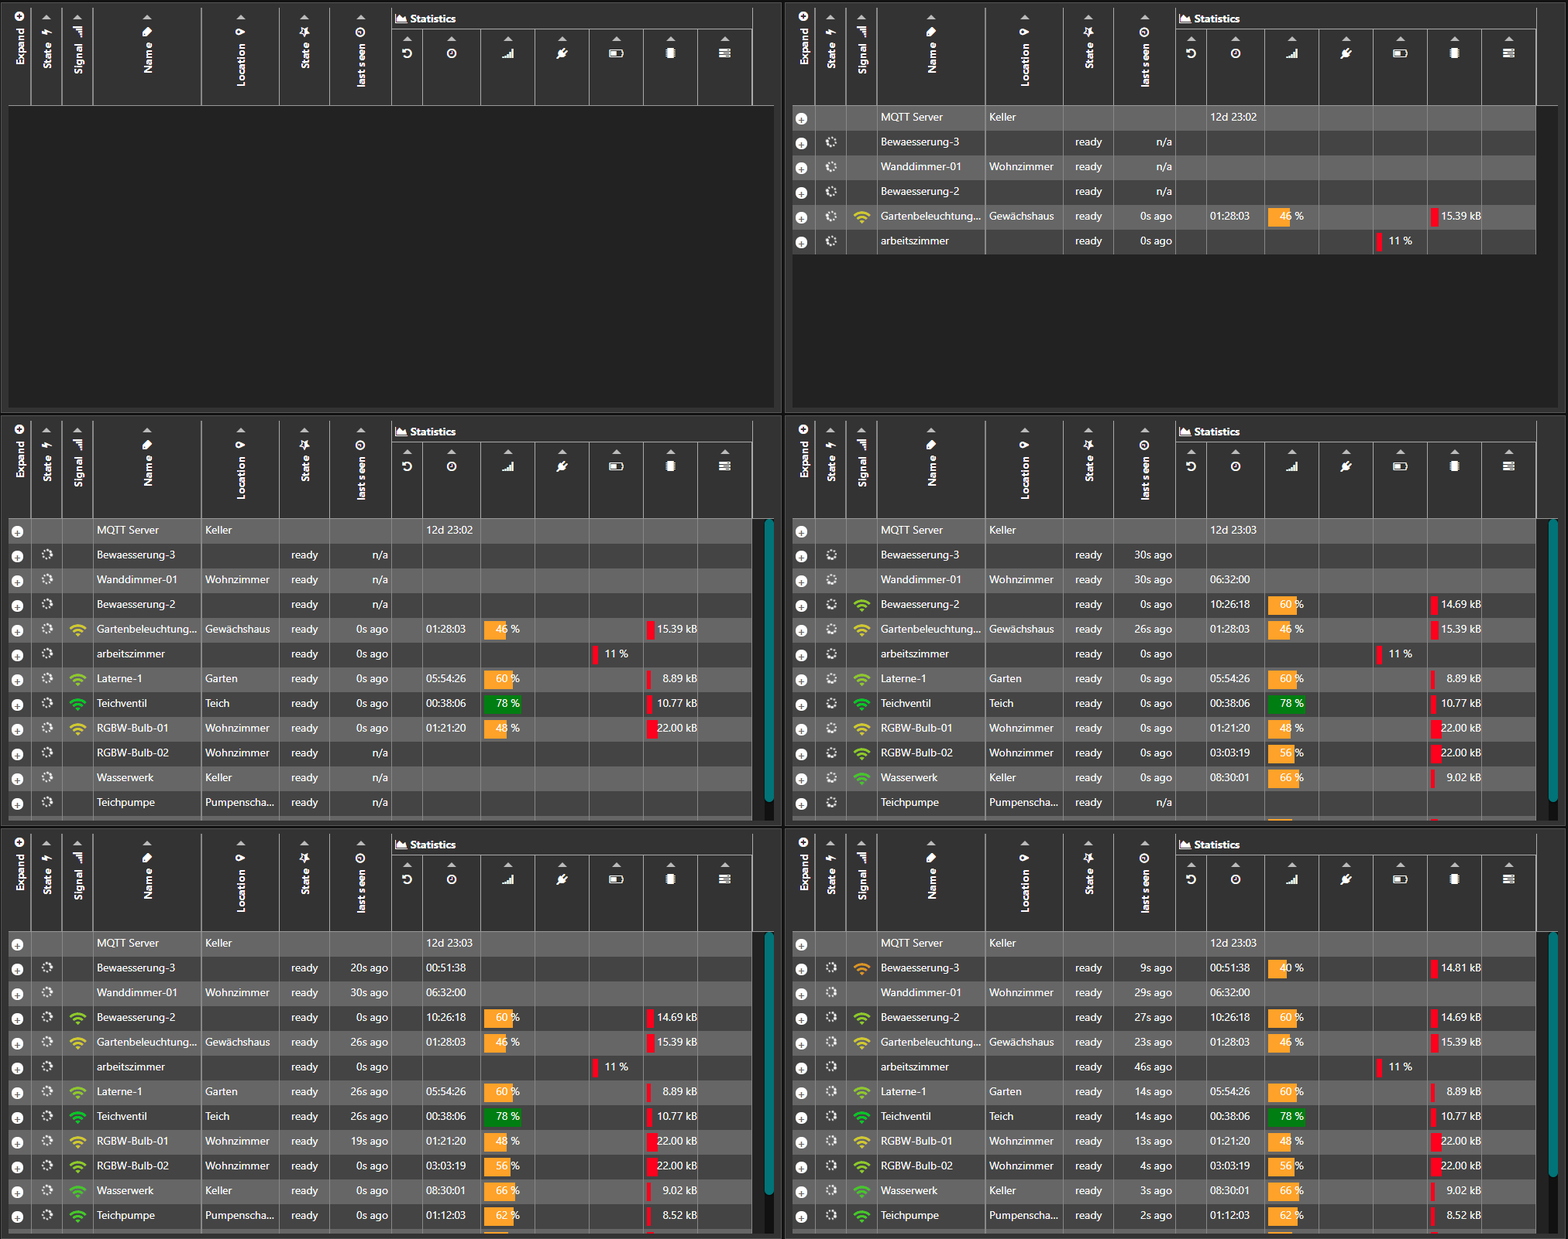
-
table-layout
The table layout can be modified interactively. Beside changing the column width and order you can hide (and un hide) rows and columns.
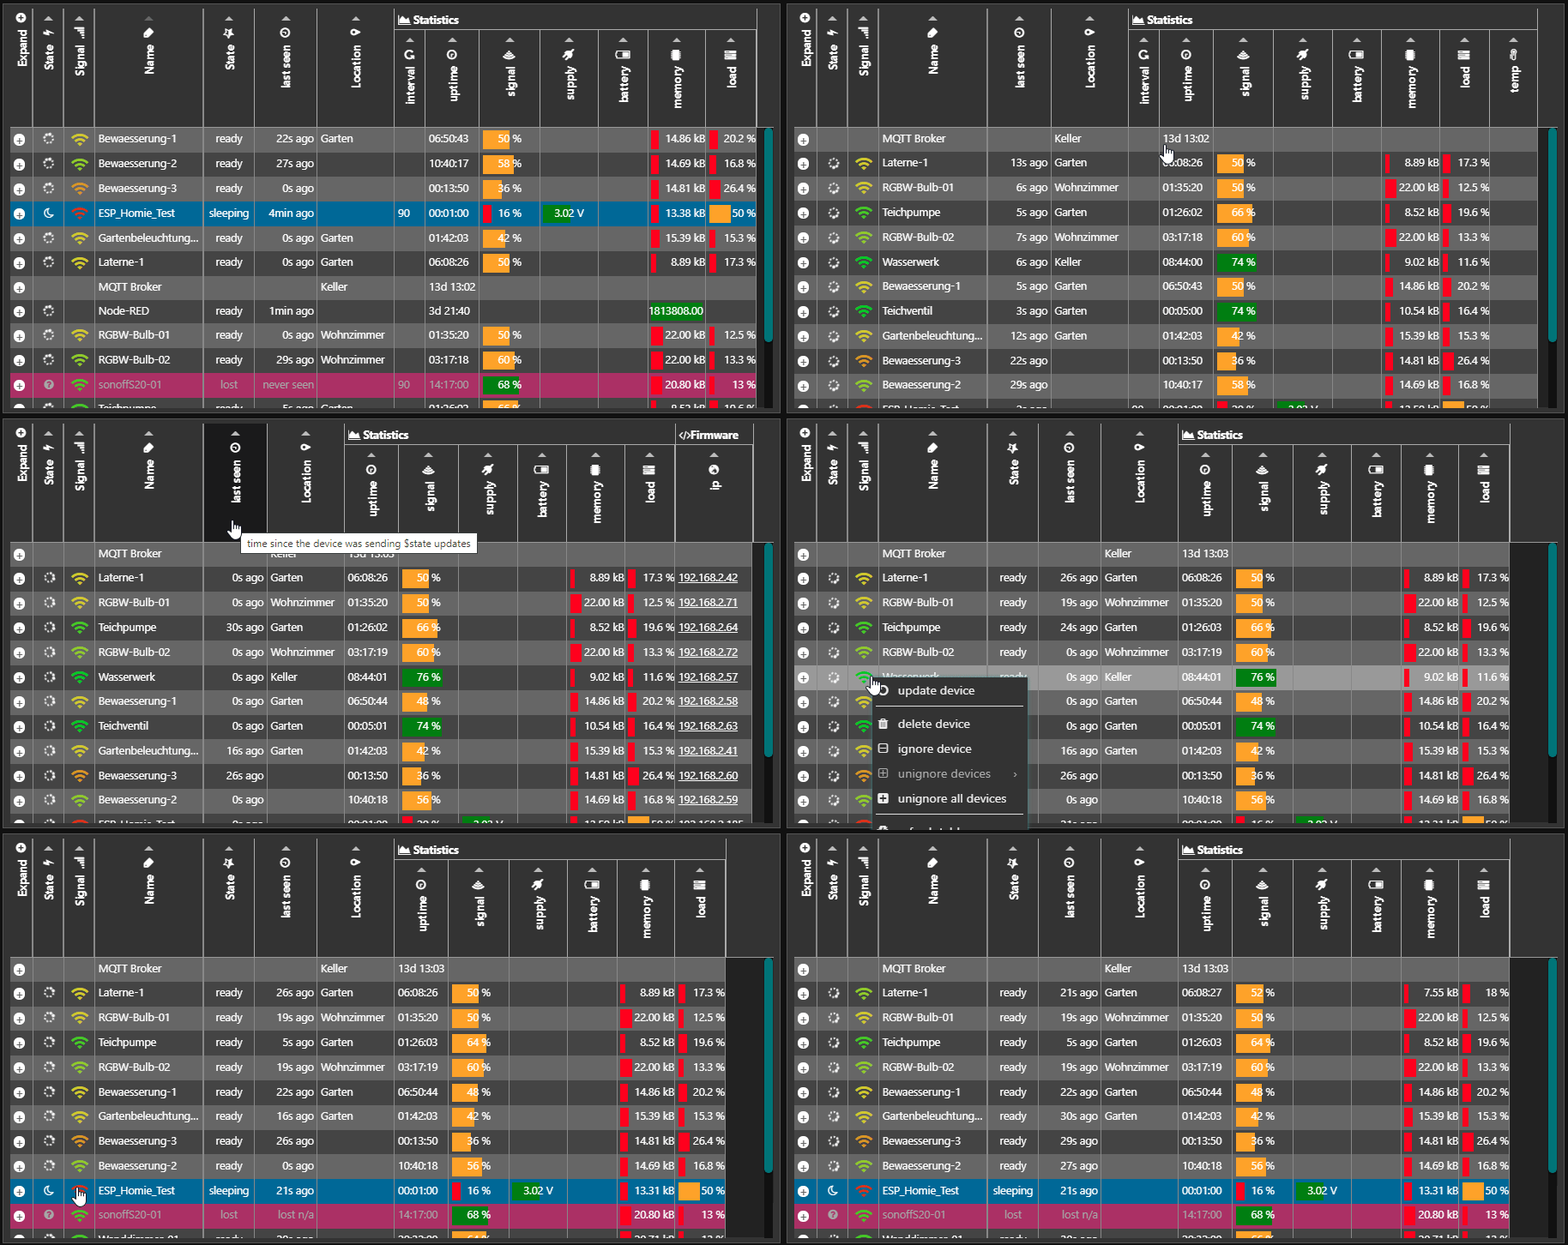
-
responsive layout
The table can be viewed with horizontal scroll (with frozen columns) or in a responsive layout

-
table edit
The table cells can be edited (where suitable). The edits are stored separately and are prevented from overwrites
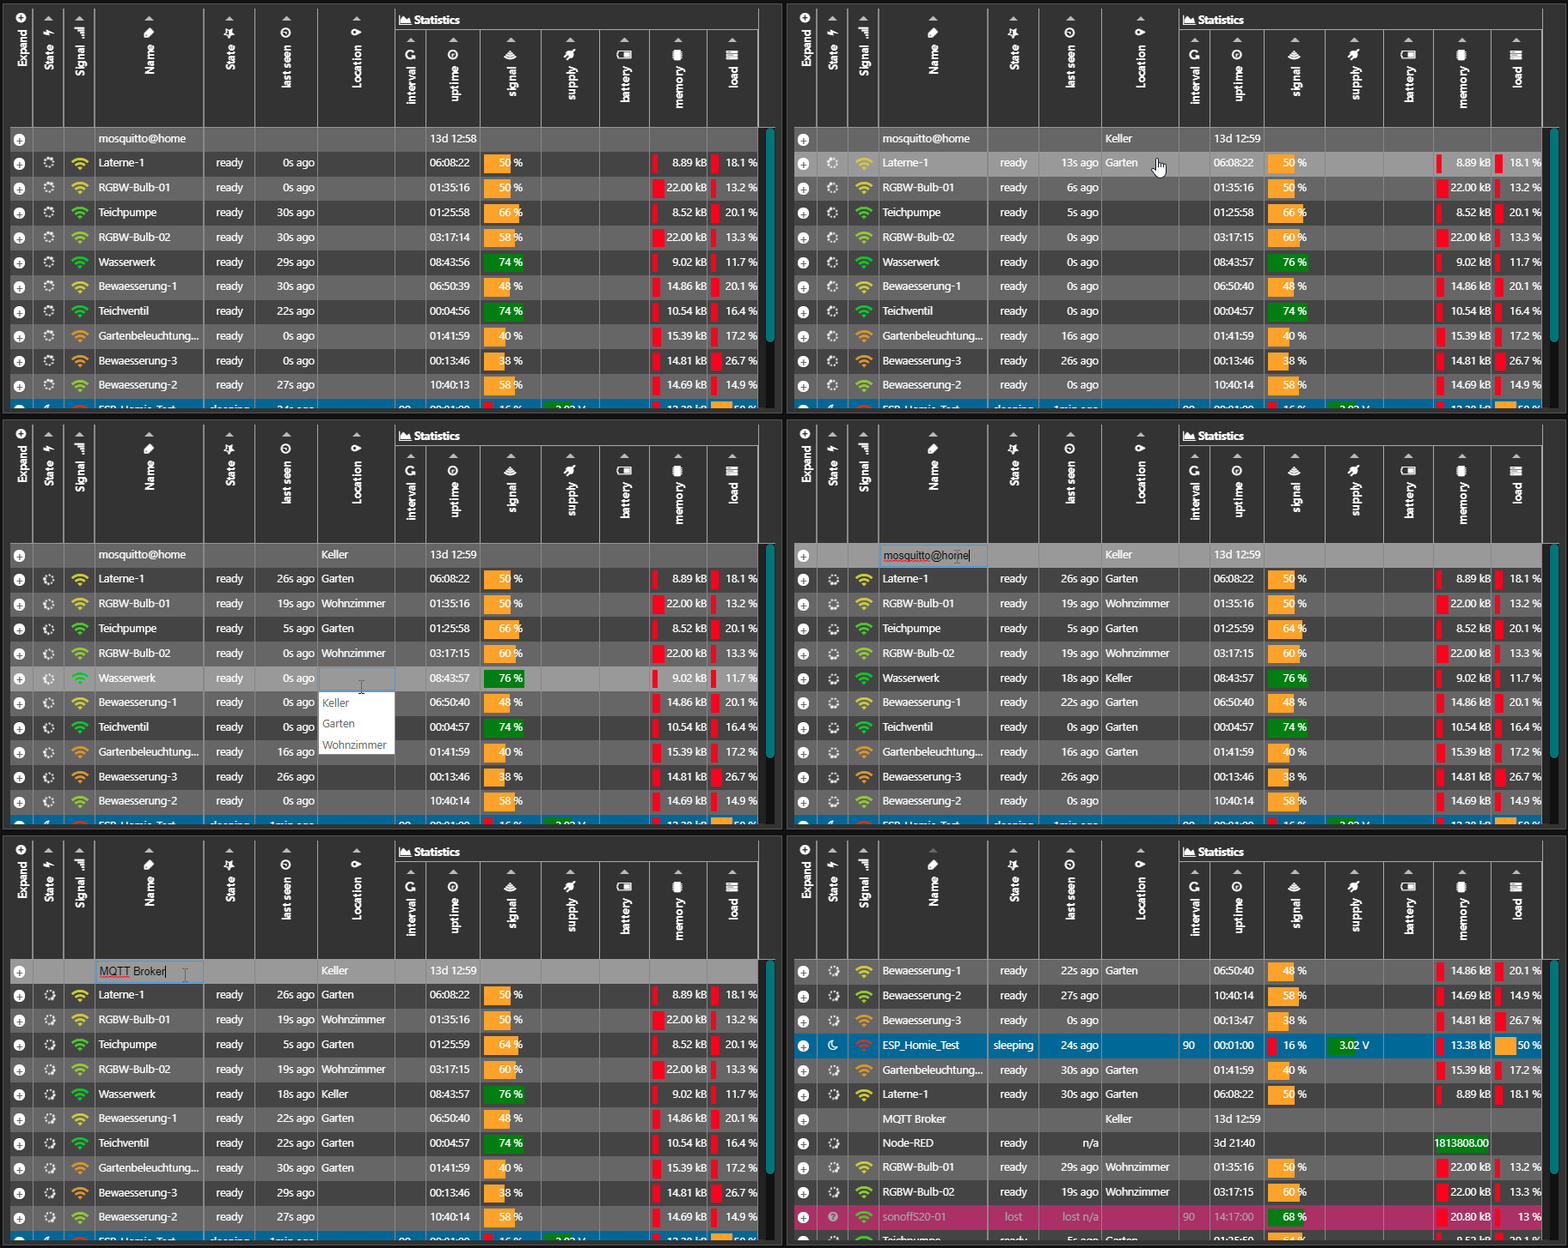
The flow is divided in three main parts
-
data acquisition: translation of the data into homie and individual user defined fields (not everything fits into the homie convention but it is a good common ground). different translator nodes can be found here
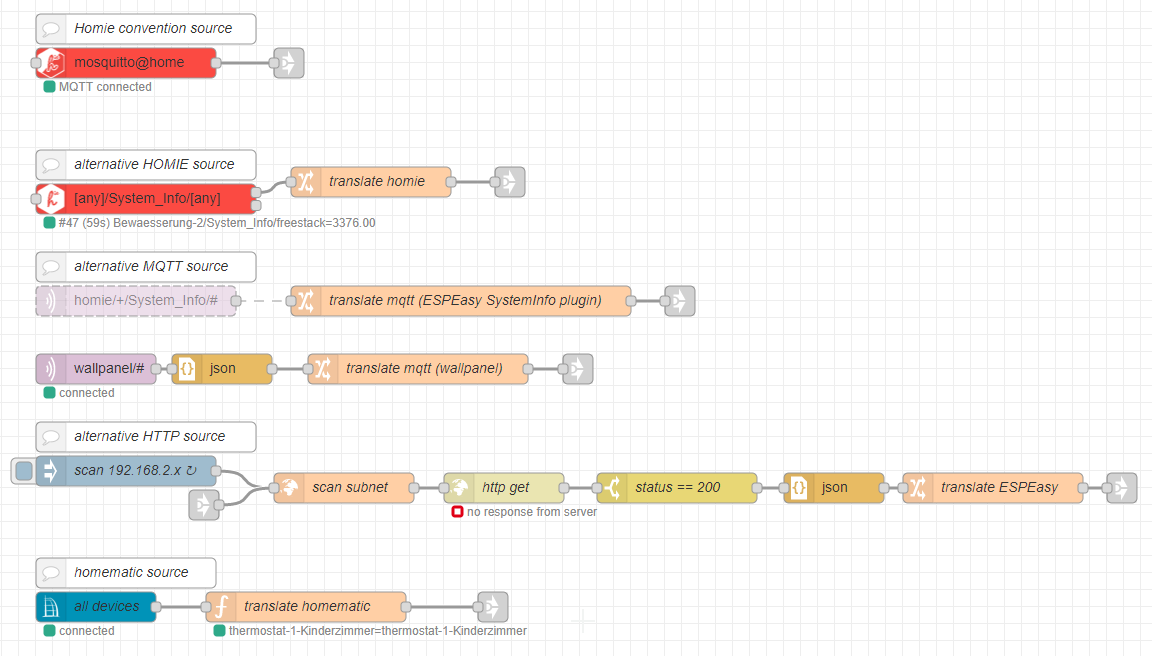
-
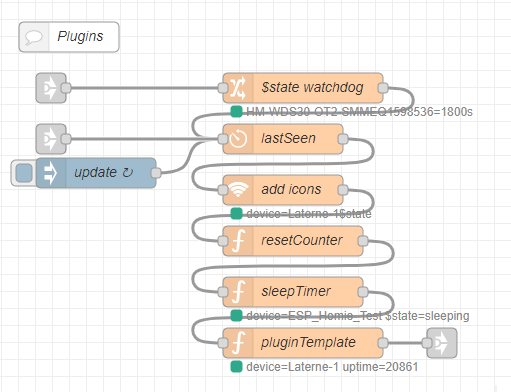
plugins: little nodes doing all kind of stuff with this data. For example a watchdog, a reset counter, max. min. or avg. uptime, add icons from the values like battery or signal and other things. To make these reusable it is essential to have a common data-set defined. different plugins can be found here
-
table handling and ui design: universal flow to handle table formatting, data storage, column width and order, cell editing and interactive stuff like context menus. different designs can be found here

-
callbacks & context menus: ui-table callbacks are passed from the second output of the
ui-table handlerto this flow to do display context menus or other do other stuff
- The flow starts with a msg coming in from mqtt / http or other sources in various shape or forms
- A translator node will process the data:
- add a unique identifier to the message in msg.topic
- add properties to the msg.state object
- using the predefined homie convention properties
- adding new properties
- filtering out not necessary or constant data
- process data (i.e. signal strength form dB to %)
- the data then will be passed into the plugin sections through in/out nodes
- Data processing is like a stack of functions
- there could be different entries to the stack. (i.e. mqtt devices can make use of the LWT functionality of the broker so they do not need the watchdog node)
- adding new fields like icons
- do other stuff with the data
- the final result will then be passed to the UI part of the flow
- the
ui-table handlershould do the heavy lifting- send the data to the table
- keep a copy of all data for tab changes or new clients connecting
- store interactive layout changes
- store interactive edits in the table
- handle commands to alter the stored data or perform other things
- handle context menus or callbacks form ui-table
- context menus are designed separately to enable individual designs
To define a common ground for all data this flow uses the homie convention which I highly recommend to take a closer look.
For devices using the homie convention there is no translator node necessary and it is recommended to skip the
$state watchdogplugin
The homie convention defines some statistic and firmware topics. The remote-device-table originates using the $stats and $fw properties The base dataset is defined by the homie convention 3.0.1 and 4.0.0 with $state and $fw extensions. If an alternative source provides all or some of the data it should first try to use the existing properties and perform conversions if necessary.
| property | description | type | format |
|---|---|---|---|
| $homie | The implemented Homie convention version | string | "4.0.0" |
| $name | the unique name of the device. This name is used to identify the device in the table. | string | "myDevice" |
| $state | current or last state of the device | string | ["ready", "lost", "init", "sleeping", "disconnected", "alert"] |
| $nodes | Nodes the device exposes | array | comma seperated list |
| $extensions | Supported extensions | array | comma seperated list |
| $implementation | An identifier for the Homie implementation | string | "esp8266" |
defined by Legacy Firmware
| property | description | type | format |
|---|---|---|---|
| $localip | IP of the device on the local network | string | "127.0.0.1" |
| $mac | Mac address of the device network interface | string | The format MUST be of the type A1:B2:C3:D4:E5:F6 |
| name | Name of the firmware running on the device. | string | Allowed characters are the same as the device ID |
| version | Version of the firmware running on the device. | string | "1.0.0" |
defined by Legacy Stats
| property | description | type | format |
|---|---|---|---|
| interval | Interval in seconds at which the device refreshes its $stats/+ |
integer | Positive greater 0 |
| uptime | Time elapsed in seconds since the boot of the device | integer | seconds |
| signal | Signal strength | Integer | in % |
| cputemp | CPU Temperature | Float | in °C |
| cpuload | CPU Load in. Average of last $stats\interval including all CPUs | Integer | %. |
| battery | Battery level. | Integer | in % |
| freeheap | Free heap. | Positive Integer | in bytes |
| supply | Supply Voltage | Float | in V |
