100_090_Legend
Previous Chapter Previous Page Next Page Next Chapter Table of content
- legend
- legendBlockSize
- legendBorders
- legendBordersColors
- legendBordersStyle
- legendBordersWidth
- legendDrawEmptyData
- legendFontColor
- legendFontFamily
- legendFontSize
- legendFontStyle
- legendColorIndicatorStrokeWidth
- [legendFillColor] (#legendfillcolor)
- [legendPosX] (#legendposx)
- [legendPosY] (#legendposy)
- [legendWhenToDraw] (#legendwhentodraw)
- [legendXPadding] (#legendxpadding)
- [legendYPadding] (#legendypadding)
- [maxLegendCols] (#maxlegendcols)
- [maxLegendLines] (#maxlegendlines)
- showSingleLegend
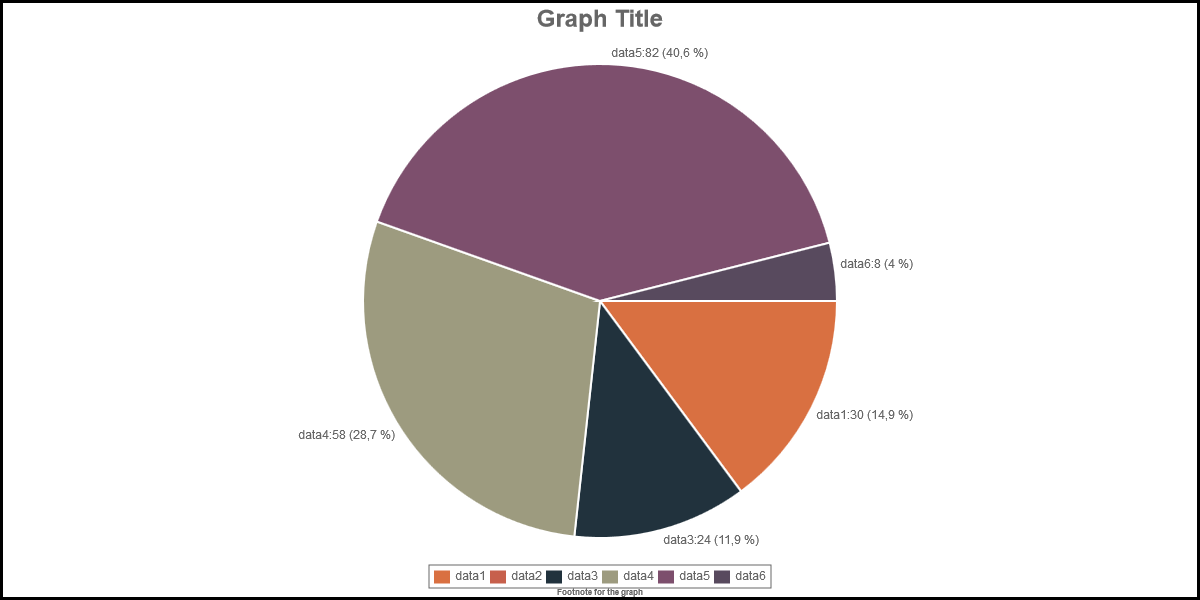
Description: At the bottom of the chart, it is possible to dispay a legend with a description of each color. Use option legend to draw the legend (legend : true) or to hide the legend (legend : false).
Chart Type : all
Values : true or false
Default Value : false
Sample : legend : true.
See also: inGraphDataDisplay
Description: the size of the blocks in the legend is defined with option legendBlockSize (in pixels). Remark : the height of the block is equal to the value of option legendFontSize.
Chart Type : all
Values : any positive value.
Default Value : 15
Sample : legendBlockSize : 20.
See also: legendFontSize
Description: If you want to surround the block with a border, set option legendBorders to true.
Chart Type : all
Values : true or false
Default Value : true
Sample : legendBorders : true
See also: legendBordersColors, legendBordersWidth
Description: set the color of the borders surrounding the block with option legendBordersColor
Chart Type : all
Values : any valid color
Default Value : "#666"
Sample :
See also: legendBorders, legendBordersWidth
Description: set the style of the borders surrounding the block with option legendBordersStyle
Chart Type : all
Values : any predefined value or an array or a function
Default value : "solid"
Sample : legendBordersStyle : "dotted"
See also:legendBorders, legendBordersColor
Description: set the width of the borders surrounding the block with option legendBordersWidth
Chart Type : all
Values : any positive integer
Default Value : 1
Sample : legendBorderWidth : 3
See also:legendBorders, legendBordersColor
Description: By default, the legend of all datasets are displayed (default value for legendDrawEmptyData is true). If you don't want to display the legend when all data of a dataset are null of undefined, set option legendDrawEmptyData to false.
Chart Type : all
Values : true or false
Default Value : true
Sample : legendDrawEmptyData : false
See also:
Description: specify the color of the text in the legend
Chart Type : all
Values : any valid color
Default Value : "#666"
Sample : legendFontColor : “black”
See also: legend, legendFontSize, legendFontStyle, legendFontFamily
Description: specify the font of the text in the legend
Chart Type : all
Values : any valid font
Default Value : "'Arial'"
Sample :
See also: legend, legendFontSize, legendFontStyle, legendFontColor
Description: specify the size of the text in the legend
Chart Type : all
Values : any positive integer
Default Value : 12
Sample : legendFontSize : 10
See also: legend, legendFontStyle, legendFontFamily, legendFontColor
Description: specify the style of the text in the legend
Chart Type : all
Values : any valid font style
Default Value : “normal”
Sample : legendFontStyle : “italic”
See also: legend, legendFontSize, legendFontFamily, legendFontColor
Description: If you use the datasetFill:false option in line charts you may want to change the height of the legend color.
Chart Types: line
Values: integer (px)
Default value: datasetStrokeWidth
Sample: datasetStrokeWidth:10
See also: #68
Description: By default, the background color of the legend is transparent; With option legendFillColor, you can specify a color for the background of the legend. A color should be specified when the legend is displayed over the chart.
Chart Types: All
Values: : any color
Default value: "rgba(0,0,0,0)
Sample: legendFillColor : "white"
See also: legendPosY, legendPosY
Description: with legendPosX, you can specify a horizontal position for the legend; By default, the legend is displayed in the middle of the canvas (legendPosX=-2). With legendPosX, you can set the legend at another place.
Chart Types: All
Values: : -2, 0, 1, 2, 3, or 4
-2 : the legend is displayed at the center of the canvas; 0 : the legend is displayed at the left part of the canvas; 1 : the legend is displayed at the left part of the chart; 2 : the legend is displayed at the center of the chart; 3 : the legend is displayed at the right part of the chart; 4 : the legend is displayed at the right part of the canvas.
Default value: -2
Sample: legendPosX : 3
See also: legendXPadding, legendPosY, maxLegendCols
Description: with legendPosY, you can specify a vertical position for the legend; By default, the legend is displayed in the bottom of the canvas (legendPosY=4). With legendPosY, you can set the legend at another place.
Chart Types: All
Values: : 0, 1, 2, 3, or 4
0 : the legend is displayed at the top part of the canvas (between the chart and the subtitle); 1 : the legend is displayed at the top part of the chart; 2 : the legend is displayed at the center of the chart; 3 : the legend is displayed at the bottom part of the chart (over the X scales); 4 : the legend is displayed at the bottom part of the canvas (between the chart and the footnote).
Default value: 4
Sample: legendPosY : 2
See also: legendXPadding, legendPosY, maxLegendCols
Description: with legendWhenToDraw, you can specify when the legend has to be drawn during the animation. By default, when the legend is drawn inside the chart, the legend is always visible during the animation. If you want, you can change this. If you prefer to see the legend only when the animation is terminated, set option legendWhenToDraw to "last".
Chart Types: All
Values: : "all", "first", "last" or a number.
"all" : the legend is always visible during the animation; "last" : the legend is displayed when the animation is completed; "first" : the legend is displayed at the very beginning of the animation (but will directly be erased because ChartNew.js erase the chart at each iteration during the animation) ; So unless you know what you do, you should not set option legendWhenToDraw to this value. A number : the legend is displayed at the iteration "number" of the animation (but will directly be erased because ChartNew.js erase the chart at each iteration during the animation) ; So unless you know what you do, you should not set option legendWhenToDraw to a number.
Default value: "all"
Sample: legendWhenToDraw : "first"
See also: legendXPadding, legendPosY, maxLegendCols
Description: with legendPosX, you can specify a horizontal position for the legend; With legendXPadding, you can specify a displacement in point on the horizontal direction.
Chart Types: All
Values: any positive or negative integer
Default value: 0
Sample: legendXPadding : -10
See also: legendYPadding, legendPosX
Description: with legendPosY, you can specify a vertical position for the legend; With legendYPadding, you can specify a displacement in point on the vertical direction.
Chart Types: All
Values: any positive or negative integer
Default value: 0
Sample: legendYPadding : 10
See also: legendXPadding, legendPosY
Description: specify the maximum number of columns for the legend. ATTENTION : if legendPosY is not 0 or 4 and legendPosX is 0 or 4, maxLegendCols is not valid; In that case, use option maxLegendLines.
Chart Types: All
Values: any positive integer
Default value: 999
Sample: maxLegendCols : 1
See also: maxLegendLines
Description: specify the maximum number of lines for the legend. This option is only valid when legendPosY is not 0 or 4 and legendPosX is 0 or 4.
Chart Types: All
Values: any positive integer
Default value: 999
Sample: maxLegendLines : 1
See also: maxLegendCols
Description: If there is only one value in the legend, the legend is not displayed (in most of the case, poeple knows the signification of the unique displayed element in the chart). You can force the display of the legend even when there is only one value with option showSingleLegend.
Chart Types: All
Values: true or false
Default value: false
Sample: showSingleLegend : true
See also:
Previous Chapter Previous Page Next Page Next Chapter Top of Page