-
Notifications
You must be signed in to change notification settings - Fork 9
Operation Instructions
The visual display is composed of a context control bar just below the application banner, and three interactive visualization areas. The right half of the display area below the context control bar is the fleet view panel. It provides a comprehensive view of the reporting devices either on a map or in a grid. The left half of the display area below the context control bar is divided into two panels with the overview panel above the detail panel. The general operation of each of the panels remains the same for any type of information displayed. The type of information to be visualized is specified by the tab selected in the context control bar.
The context control bar is composed of two rows of elements. The default context includes all sites, a date range of “Today-30”, a Mode of “Grid”, with the “Events” tab selected.
View controls
The view control elements are named collections of user selected view parameters that have been changed from the default values and saved for future use. Selecting a named view control element immediately loads the specified parameters such as sites, date range, mode, and tab. The Default view control cannot be changed by a user and is always available in the drop down list. The Default view control is loaded when the application is started. A system provided “Last Session” view control is also included that can restore the last session whenever the application is closed and reopened.
Site selection
The site selection element provides a drop down control to select or deselect sites to be displayed in the visualization panels.
Date selection
The date selection element provides editable From: and To: date fields to specify arbitrary date ranges. The “Load” button beside the editable date range loads data from the date range specified. A drop down list provides single click data specification for predefined date ranges.
Mode selection
The mode selection element allows the user to specify a map or grid display in the fleet view panel.
Dashboard tabs
Dashboard tab elements control the type of information that will be displayed in the visualization panels. For each tab, the information is specific to the sites selected and date range specified. The events tab filters the information such that it is specific to events previously analyzed from input waveform data. The trending tab filters the information such that it is specific to periodically recorded values. The faults tab further limits the events available through the events tab such that information is only presented that relates to the specific event type classified as a fault. The Completeness tab presents information about how much data is received with respect to the data that is expected. The correctness tab presents information about the accuracy of the data received with identification of latched values, non-congruent values, and values that are outside of engineering reasonableness.
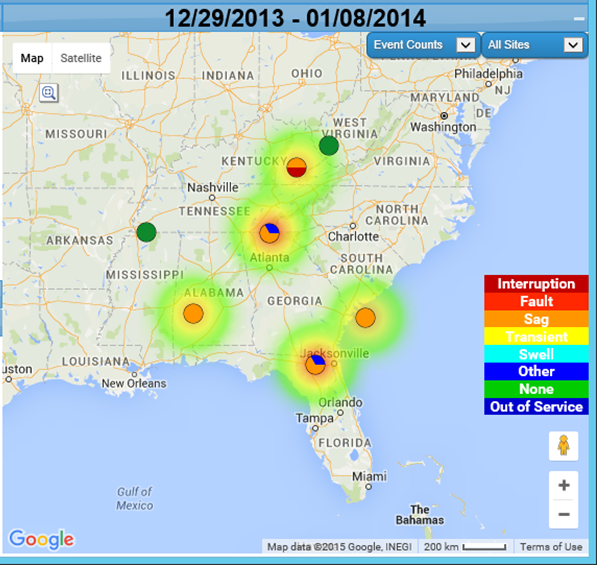
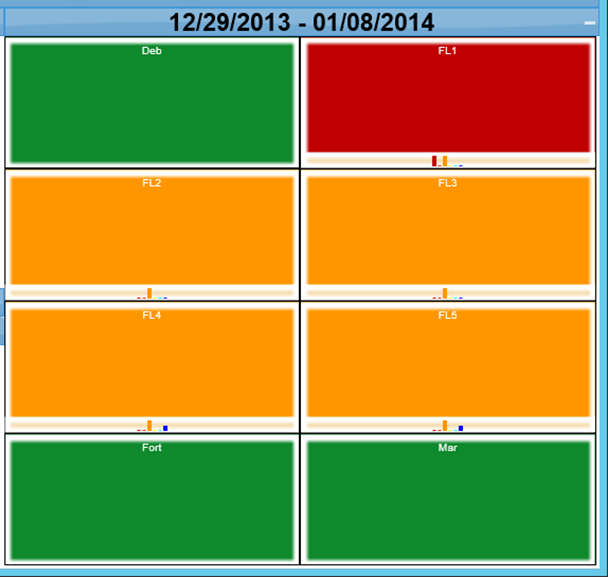
The fleet view panel occupies the right half of the visual display space and presents information regarding site locations in either a grid or map display. Sites may be selected or deselected in either view. A single click will select or deselect an individual site. Control+click allows multiple site select or deselect. The site symbols in the map display and the site squares in the grid display are color coded according to the type of information specified by the dashboard tab selection. An example fleet view panel display would present event count by type for all sites over a specified time range.
Fleet view panel example map view:
Fleet view panel example grid display:
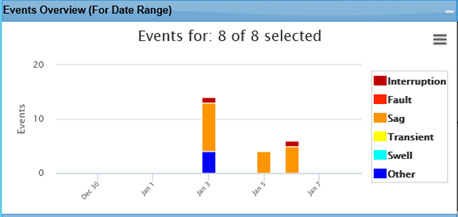
The overview panel occupies the top portion of the left half of the visual display space and presents a summary histogram of the appropriate data as specified through the view control elements and user selections. An example overview panel display is event count by type over a specified time range for the selected sites.
Overview panel example display:
The detail panel occupies the bottom portion of the left half of the visual display space and presents detailed information of information for a single day selected by clicking on a bar in the overview panel. An example detail panel display is event detail for a selected day.
Detail panel example display:
A list of events for a site ordered by line is displayed by clicking the icon
Example display of events by line for a site:
An interactive waveform viewer is available by clicking the icon
Example display of waveform viewer:


