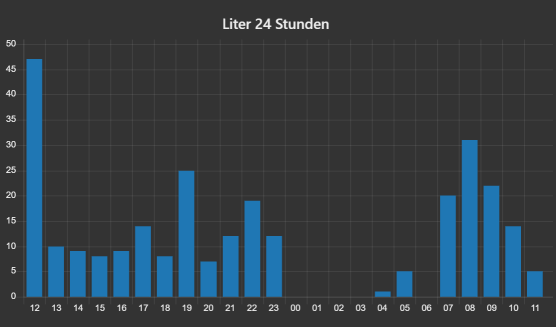
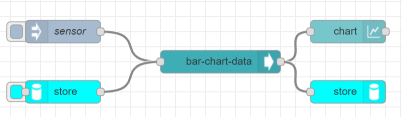
This node transforms msg.payload, attaches (and stores) past values and build a message that could be linked to the ui_chart node configured as "bar chart".
It can handle measurements (e.g. current power consumption) or meter readings (e.g. gas/water/energy meter count) and calculate the sum, min, max or average in a customizable time range.
Works with multiple topics, too.
- This is a Fork of the orginal project which can be found here: https://github.com/arneman/node-red-contrib-dashboard-bar-chart-data
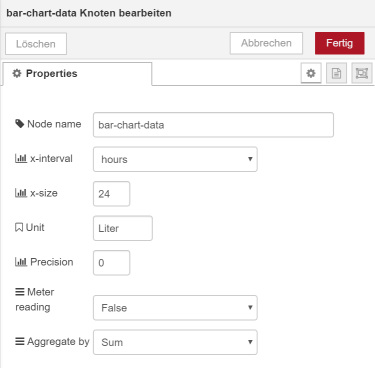
- x-interval
- 1 bar per:
- second
- minute
- quarter-hour
- hour
- day
- year
- x-size
- How many bars should be displayed. Example: x-interval=hours, x-size=24 : 24 bars, each 1 hour. That means that the last 24 hours will be displayed
- Unit
- The unit of the payload, will be displayed in the bar-chart
- Precision
- Number of decimals
- Meter reading
- Set this to "True" if msg.payload is a meter reading, so that this node will use the difference of the current and last value.
- True: msg.payload is meter reading, like the total energy, gas or water meter value or operating hours
- False: msg.payload is a measurement, like power (watt), pressure or temperature
- Aggregate by
-
- sum: sum all values in x-interval
- min: just display the smallest value in x-interval
- max: just display the largest value in x-interval
- avg: average value in x-interval
- Screenshot
-
- A message with the payload "clear" and the same topic like the sensor will reset the data for this specific sensor only. A message with the payload "clear" without a topic (empty string) will delete all data, so that the chart will be blank again.
- If you put the output of this node to the input of this kind of node (via
persist node), the data will be restored. This could be helpful to avoid getting a blank bar-chart after node-red has been restarted (reboot).
- If msg.ts or msg.timestamp is given, this timestamp will be used for the reading instead of the current timestamp. You could use this feature to load (older) logfiles into bar-chart data. Caution: All values older than the given timestamp will be discarded => You have to start with the oldest value and will loose all values that are not inside the log files - except the current values are older than the ones from the logfile.
- This is included in the output message (and could be used to set chart title etc.):
- The node settings (unit, x_interval, x_size, precision, is_meter_reading, agg_by) as json in
msg.settings- The smallest value of all bars (min) in
msg.min- The largest value of all bars (max) in
msg.max- The sum of all bars in
msg.sum- The last message recieved in the time period only
msg.none - The node settings (unit, x_interval, x_size, precision, is_meter_reading, agg_by) as json in
[{"id":"307f07f.8b8c1f8","type":"bar-chart-data","z":"3b18da32.bba756","name":"bar-chart-data","x_interval":"seconds","x_size":"24","unit":"Liter","precision":"0","is_meter_reading":"False","agg_by":"sum","x":340,"y":140,"wires":[["11edb254.d31a6e","3e6bc8b7.f4bc88"]]},{"id":"11edb254.d31a6e","type":"ui_chart","z":"3b18da32.bba756","name":"","group":"c716d8f1.4bb848","order":3,"width":"12","height":"4","label":"Liter letzte {{msg.settings.x_size}} Sekunden {{msg.data_sum}}","chartType":"bar","legend":"false","xformat":"HH:mm:ss","interpolate":"linear","nodata":"","dot":false,"ymin":"","ymax":"","removeOlder":"30","removeOlderPoints":"","removeOlderUnit":"60","cutout":0,"useOneColor":true,"colors":["#1f77b4","#aec7e8","#ff7f0e","#2ca02c","#98df8a","#d62728","#ff9896","#9467bd","#c5b0d5"],"useOldStyle":false,"outputs":1,"x":510,"y":100,"wires":[[]]},{"id":"3e6bc8b7.f4bc88","type":"persist in","z":"3b18da32.bba756","name":"store","storageNode":"e0e7ea5c.056af8","x":510,"y":180,"wires":[]},{"id":"8343e961.cbf7e8","type":"inject","z":"3b18da32.bba756","name":"sensor","topic":"devices/homie-har/water/liter","payload":"1","payloadType":"num","repeat":"","crontab":"","once":false,"onceDelay":0.1,"x":130,"y":100,"wires":[["307f07f.8b8c1f8"]]},{"id":"29a85329.d6b03c","type":"persist out","z":"3b18da32.bba756","name":"store","storageNode":"e0e7ea5c.056af8","x":130,"y":180,"wires":[["307f07f.8b8c1f8"]]},{"id":"c716d8f1.4bb848","type":"ui_group","z":"","name":"bar-chart","tab":"957fd14a.a1277","disp":true,"width":"12","collapse":false},{"id":"e0e7ea5c.056af8","type":"persist-store","z":"","filename":"~/store.json","interval":"60"},{"id":"957fd14a.a1277","type":"ui_tab","z":"","name":"bar-chart","icon":"dashboard","disabled":false,"hidden":false}]