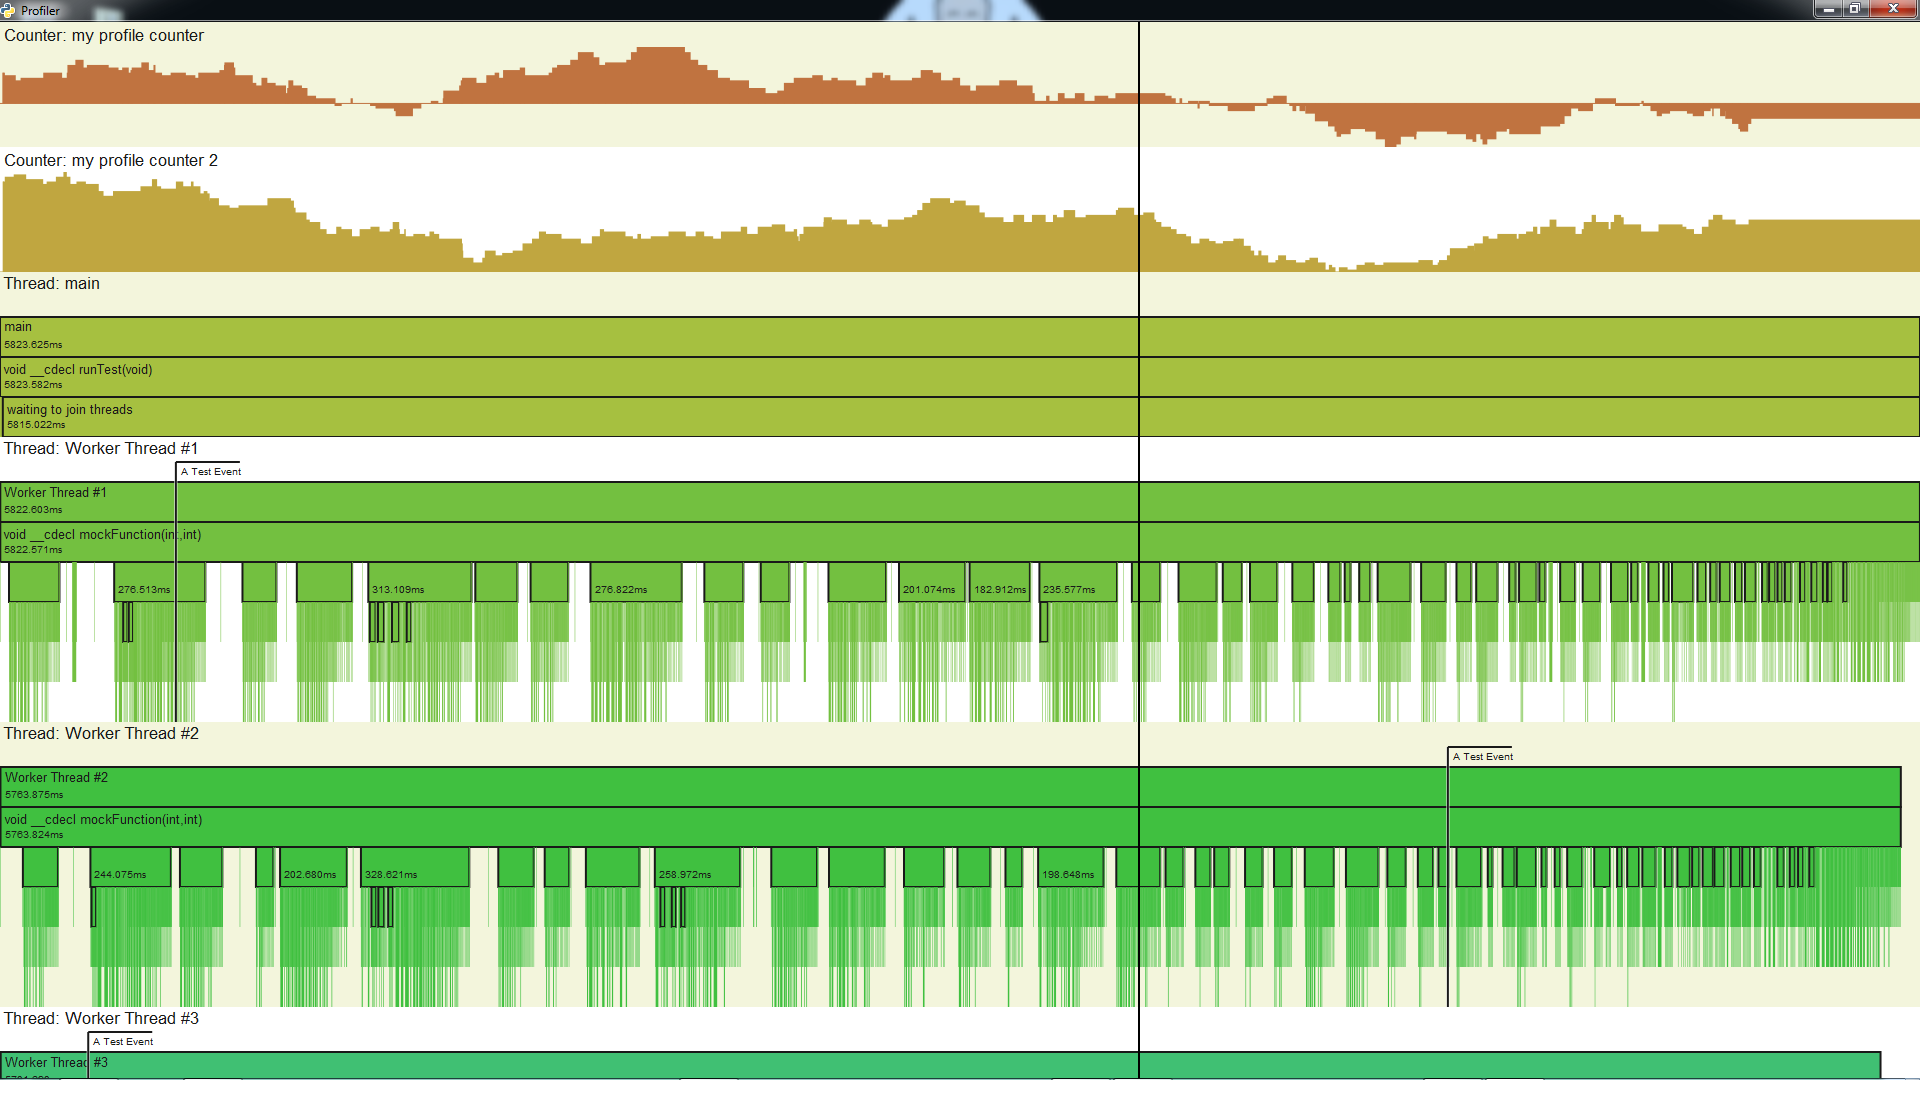
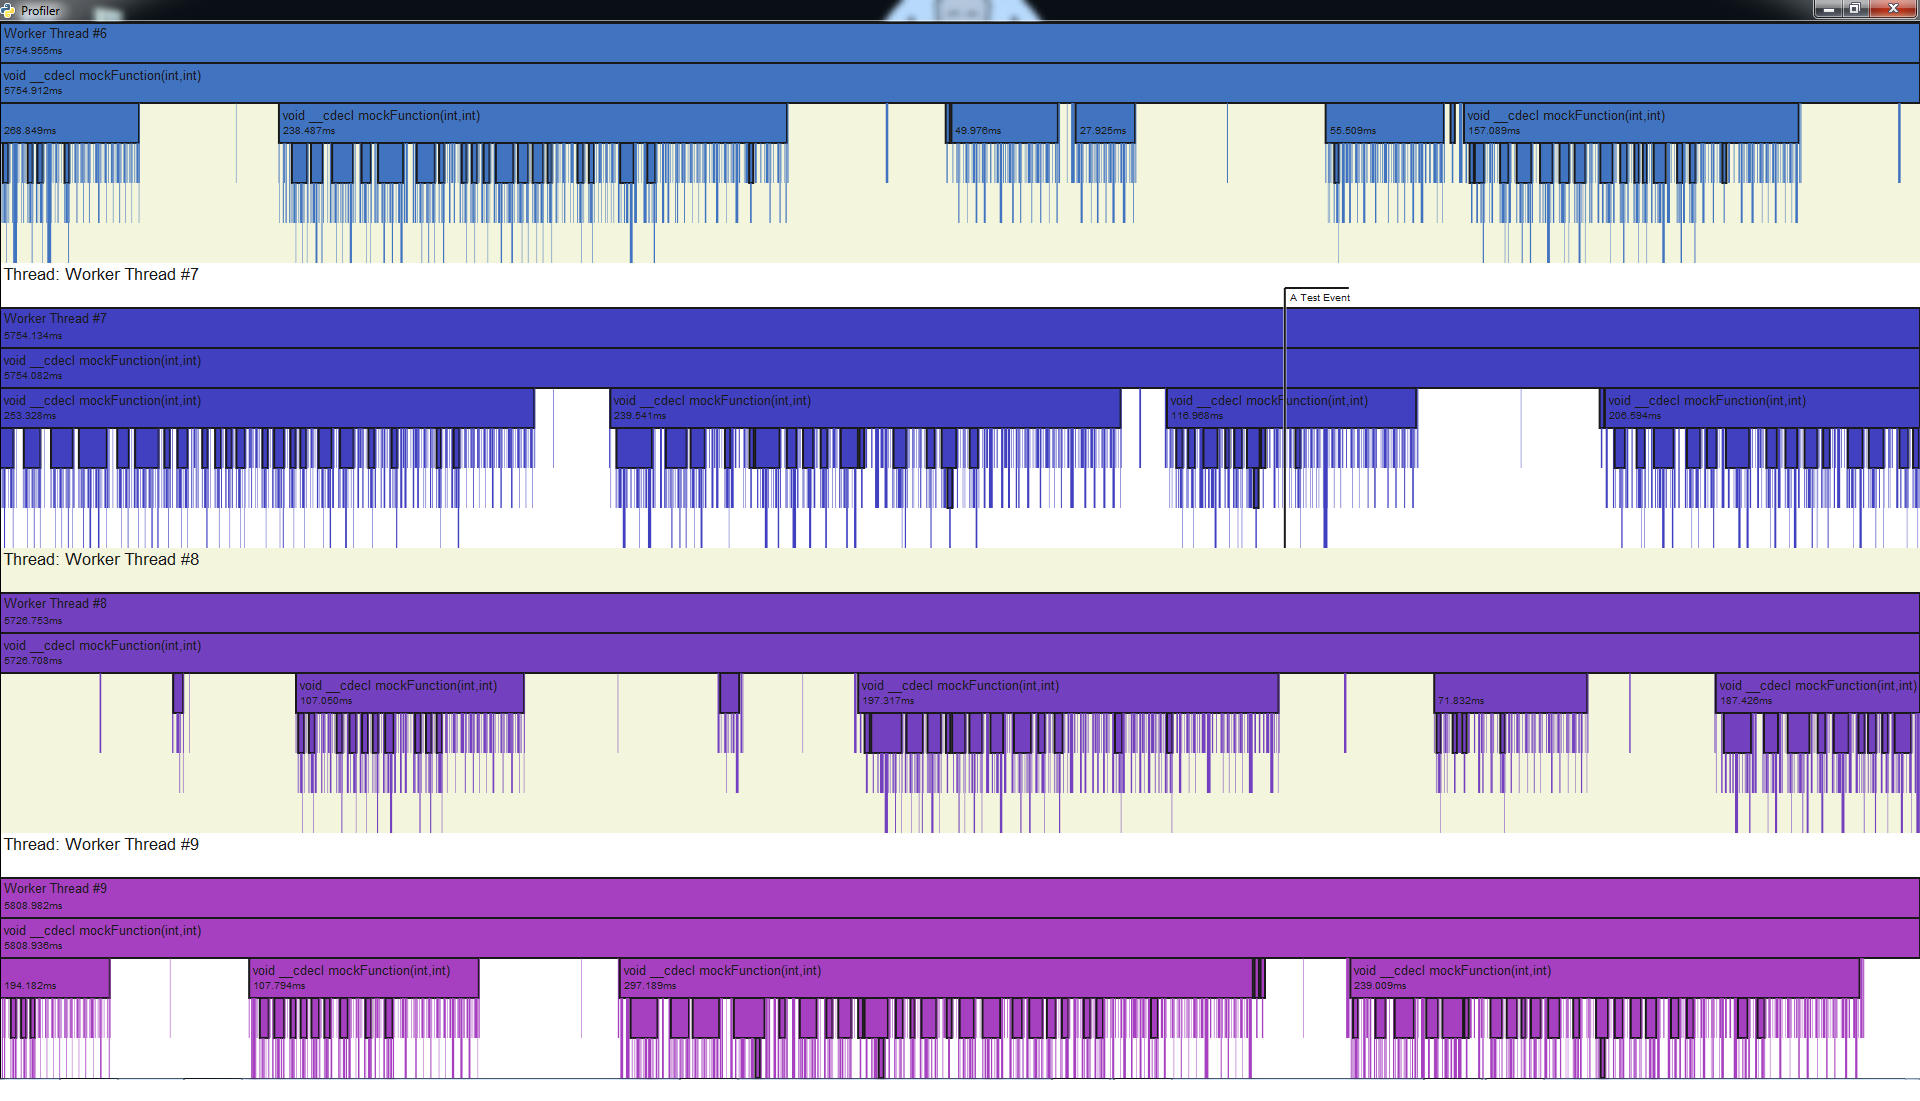
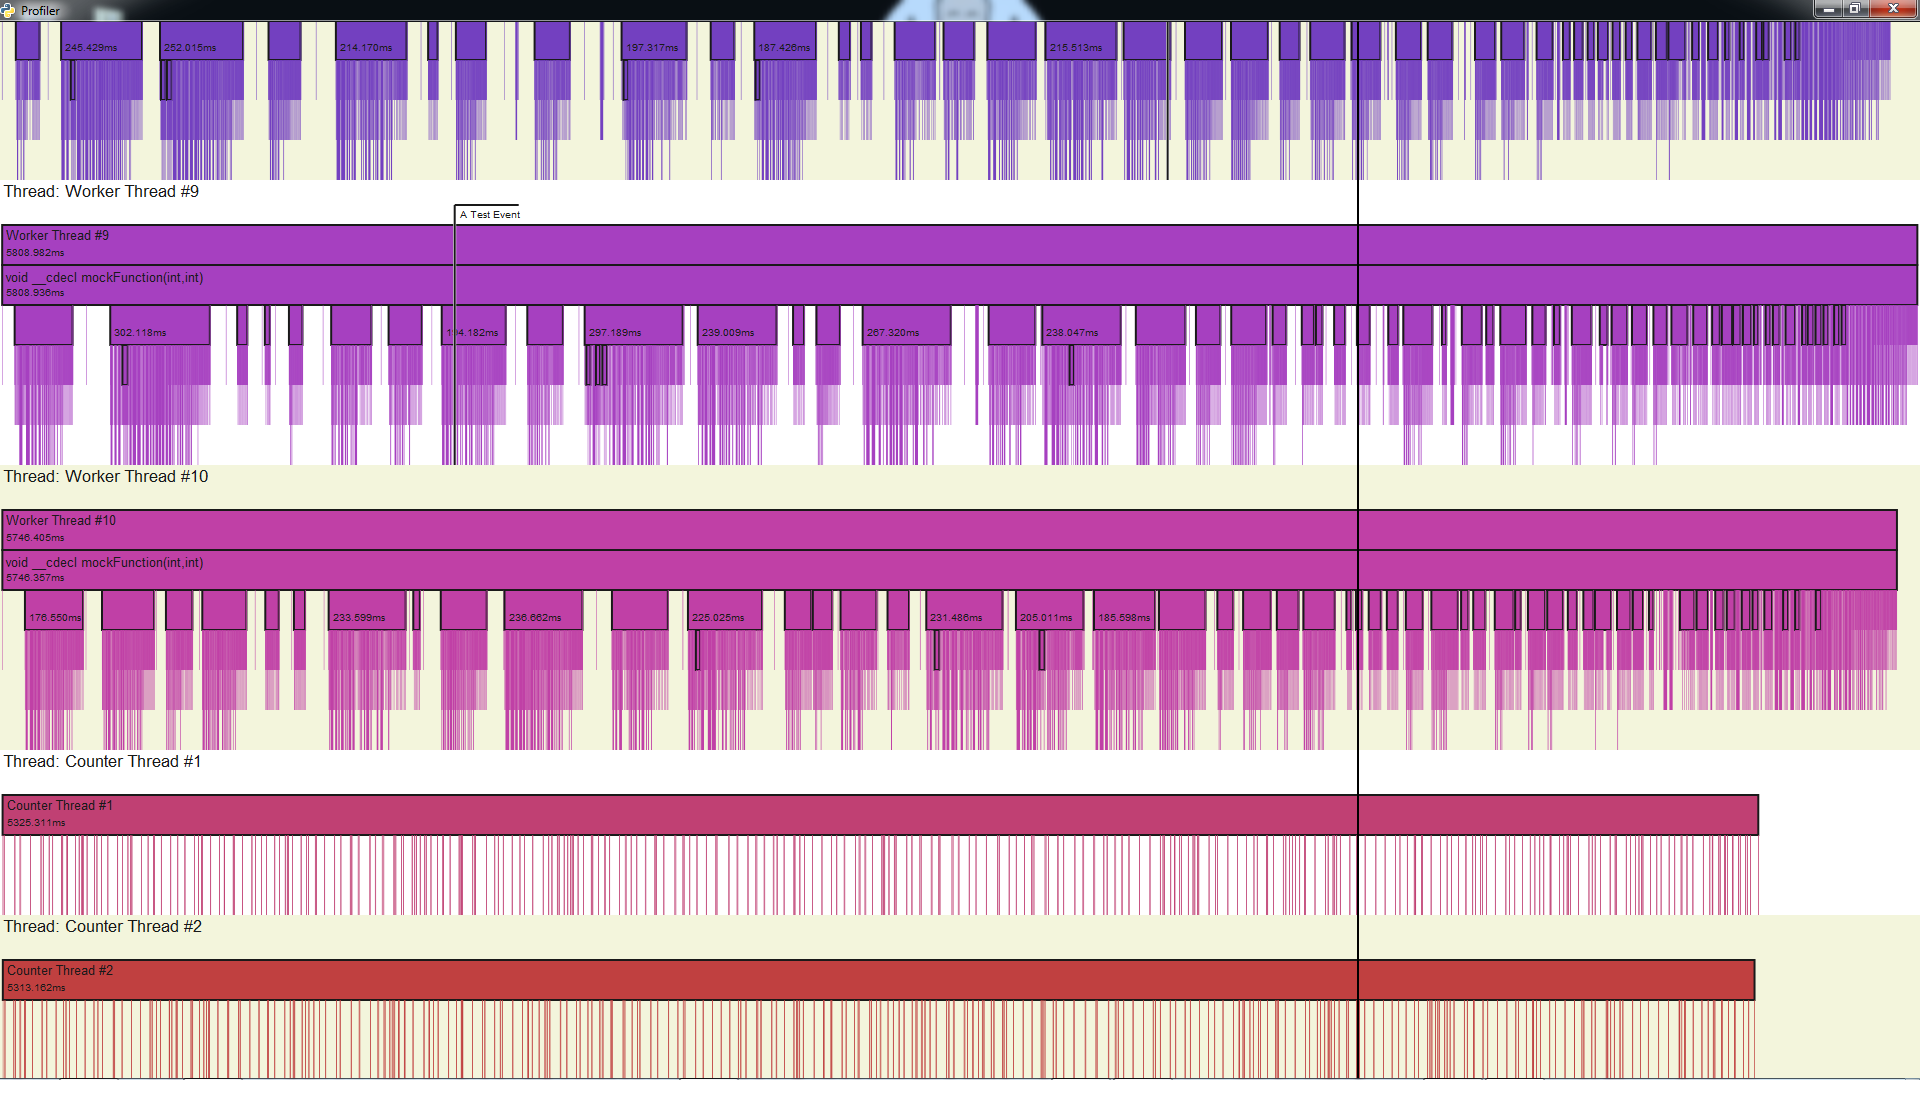
Visualise profile data.
- Python2.7 (tested with win32)
- PyGTK
- On Windows, I would recommend the 'all-in-one installer'
- Tested on Windows 7, but would also expect this to run on Linux/MacOS
-
Generate a profile text file
-
Start Visualiser at command line
python profiler.pyw --filename ../profile/ProfileSampleApp/profile.txt
-
Pan - move your mouse while holding down mouse button 1 or 2
-
Zoom - use your mouse wheel to zoom in/out
The visualiser expects profile data in a specific text format.
The C++ Profiler generates this text format.
T 0 main
F 0 0 main
S 0 0 39469
F 0 1 void __cdecl runTest(void)
S 0 1 39523
F 0 2 start threads
S 0 2 39582
T 1 WorkerThread #1
F 1 0 WorkerThread #1
S 1 0 41191
F 1 1 void __cdecl mockFunction(int,int)
S 1 1 41312
F 1 2 int __cdecl getRandomNumber(int)
S 1 2 41357
F 1 3 mutex acquired
S 1 3 41413
E 1 3 41527
E 1 2 41574
T 2 WorkerThread #2
F 2 0 WorkerThread #2
T 0 main
T <Thread ID> <Thread Label>\n
-
'Thread ID' should be unique for each thread
-
'Thread Label' is parsed as all remaining characters until the newline, so it can include spaces
F 1 3 void __cdecl runTest(void)
F <Thread ID> <Function ID> <Function Label>\n
-
'Thread ID' corresponds to the Thread ID of a Thread registered with ( T )
-
'Function ID' should be unique for each function within each thread
- i.e. Each Thread can allocate Function IDs independently
-
'Function Label' is parsed as all remaining characters until the newline, so it can include spaces
(note: this is also used to report a 'scope')
Log the time when a sample starts.
A Sample is a individual call to a function.
The 'Start Sample' and 'End Sample' log entries are used to log times at which functions are entered/left.
For example: if a single function were to be called multiple times (including recursively) then you would expect that function to be registered once ( F ) and then multiple samples would start and end ( S + E ).
S 1 3 41413
S <Thread ID> <Function ID> <Clock Time in Microseconds>
-
'Thread ID' corresponds to the Thread ID of a Thread registered with ( T )
-
'Function ID' corresponds to the Function ID of a Function registered with ( F )
E 1 3 41527
E <Thread ID> <Function ID> <Clock Time in Microseconds>
-
'Thread ID' corresponds to the Thread ID of a Thread registered with ( T )
-
'Function ID' corresponds to the Function ID of a Function registered with ( F )
V 3 4 Frame Start
V <Thread ID> <Event ID> <Event Label>\n
Register an event for a thread, that can then be emitted multiple times.
-
'Thread ID' corresponds to the Thread ID of a Thread registered with ( T )
-
'Event ID' should be unique for each event within each thread
- i.e. Each Thread can allocate Event IDs independently
-
'Event Label' is parsed as all remaining characters until the newline, so it can include spaces
Y 3 4 566344
Y <Thread ID> <Event ID> <Clock Time in Microseconds>\n
-
'Thread ID' corresponds to the Thread ID of a Thread registered with ( T )
-
'Event ID' corresponds to the Event ID of a Event registered with ( V )
C 3 My Counter Label
C <Counter ID> <Counter Label>
-
'Counter ID' should be unique for each counter
-
'Counter Label' is parsed as all remaining characters until the newline, so it can include spaces
D 3 33443 99
D <Counter ID> <Clock Time in Microseconds> <Value>
-
'Counter ID' corresponds to the Counter ID of a Counter registered with ( C )
-
'Value' is a signed 32bit integer
-
Collate intrusive / exclusive stats for each sample, for each Thread
-
Highlight sample that pointer hovers over
- Tooltip with summary data
-
Highlight counter sample that pointer hovers over
- Tooltip with counter value
-
Add scale for each counter (max / min values)
-
Add time scale at top of window
-
Multi-Threaded rendering
- decouple rendering from main thread to a separate render thread
- double-buffer rendering (i.e. render to background buffer while foreground buffer is used on screen)
- at startup, cache a low-rez render of all profile data


