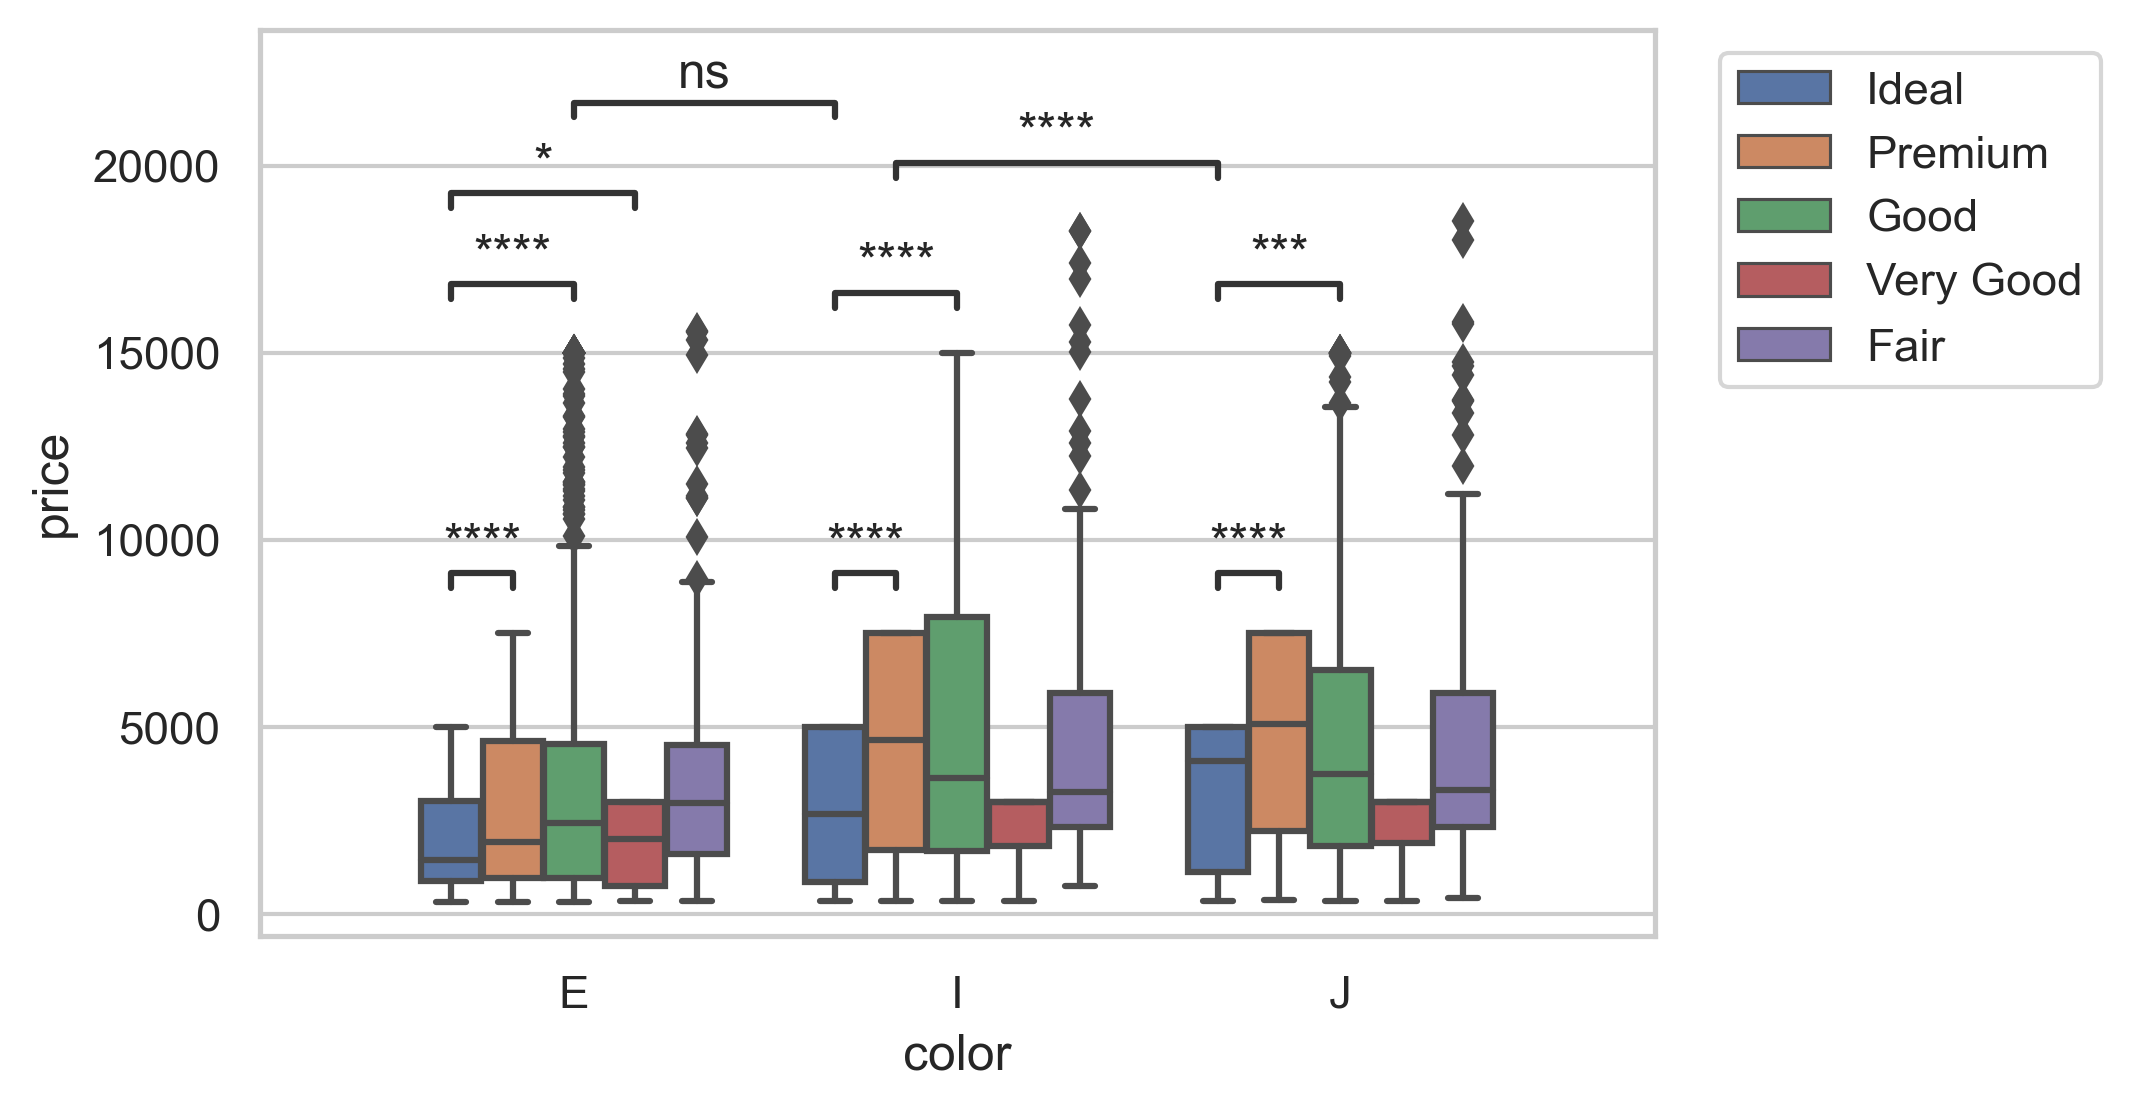
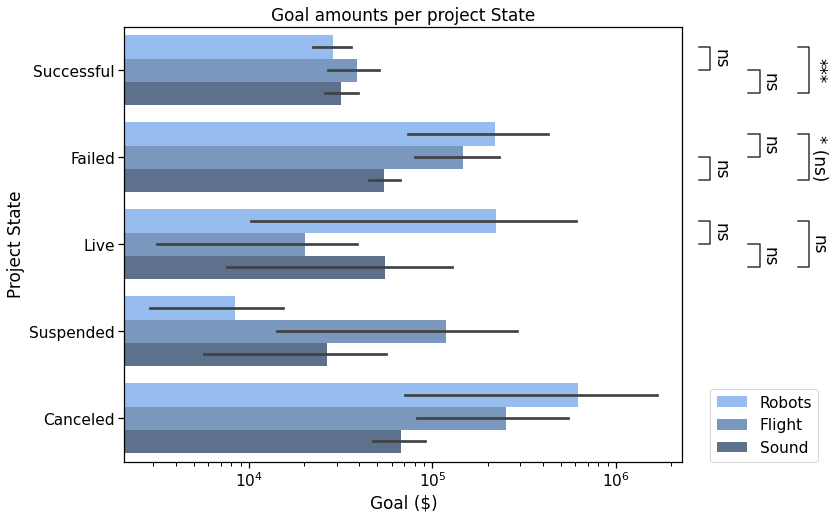
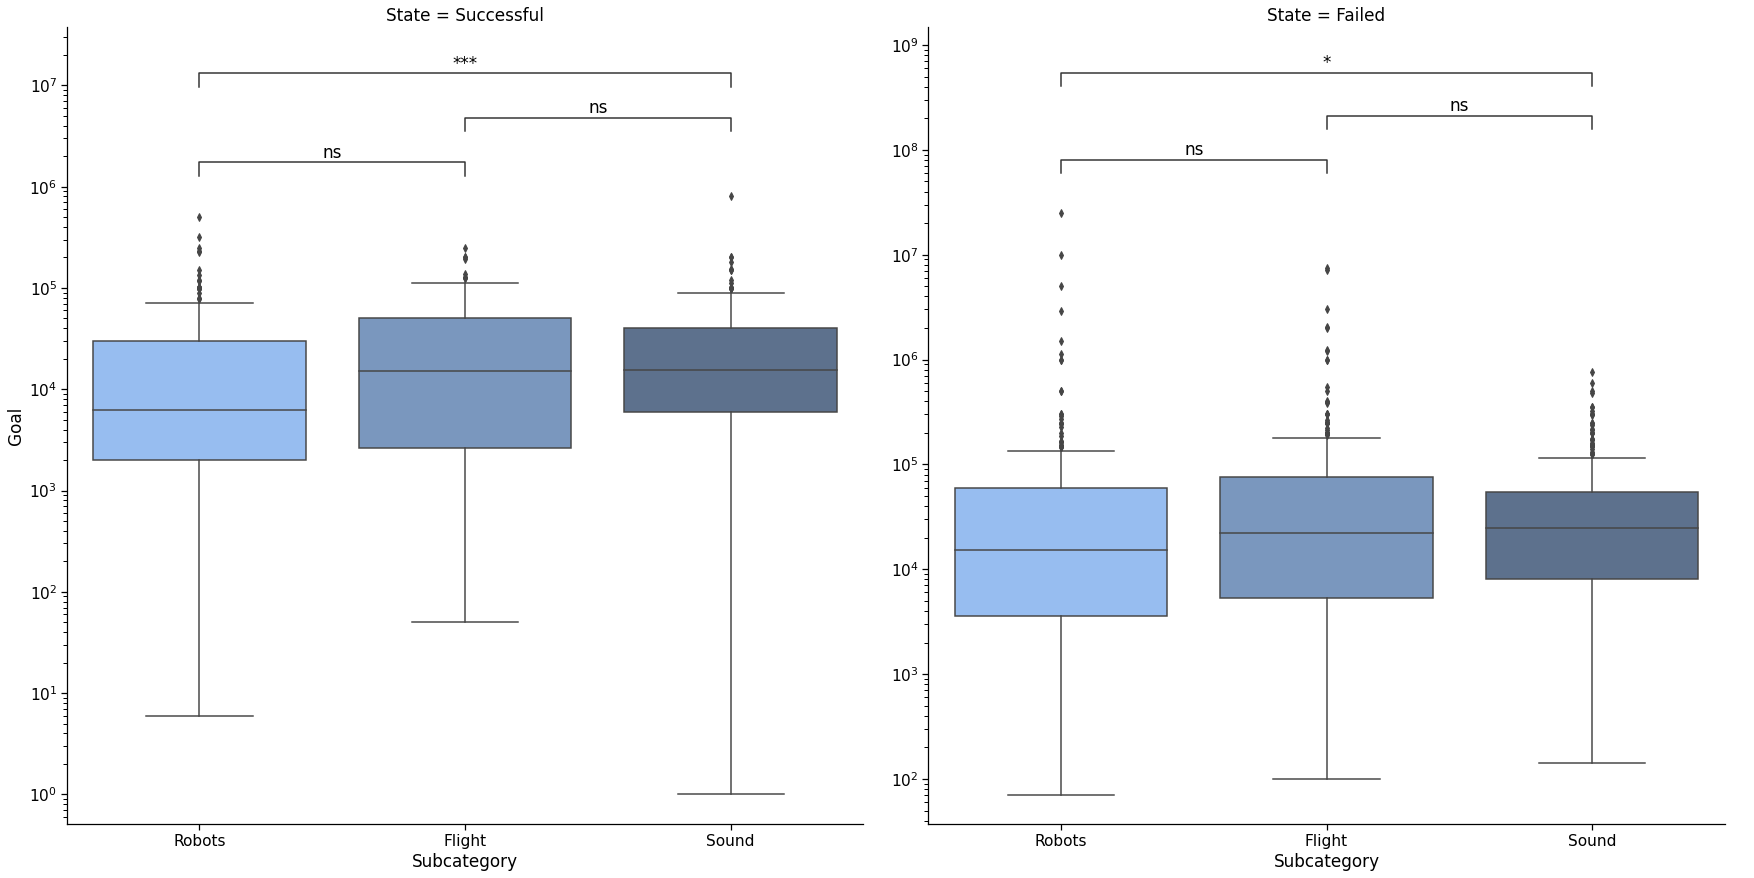
Python package to optionally compute statistical test and add statistical annotations on plots generated with seaborn.
This repository is based on webermarcolivier/statannot (commit 1835078 of Feb 21, 2020, tagged "v0.2.3").
Additions/modifications since that version are below represented in bold (previous fixes are not listed).
! From version 0.4.0 onwards (introduction of Annotator), statannot's API
is no longer usable in statannotations.
Please use the latest v0.3.2 release if you must keep statannot's API in your
code, but are looking for bug fixes we have covered.
statannot's interface, at least until its version 0.2.3, is usable in
statannotations until v.0.3.x, which already provides additional features (see
corresponding branch).
- Single function to add statistical annotations on plots
generated by seaborn:
- Box plots
- Bar plots
- Swarm plots
- Strip plots
- Violin plots
- Supporting
FacetGrid
- Integrated statistical tests (binding to
scipy.statsmethods):- Mann-Whitney
- t-test (independent and paired)
- Welch's t-test
- Levene test
- Wilcoxon test
- Kruskal-Wallis test
- Brunner-Munzel test
- Interface to use any other function from any source with minimal extra code
- Smart layout of multiple annotations with correct y offsets.
- Support for vertical and horizontal orientation
- Annotations can be located inside or outside the plot.
- Corrections for multiple testing can be applied
(binding to
statsmodels.stats.multitest.multipletestsmethods):- Bonferroni
- Holm-Bonferroni
- Benjamini-Hochberg
- Benjamini-Yekutieli
- And any other function from any source with minimal extra code
- Format of the statistical test annotation can be customized: star annotation, simplified p-value format, or explicit p-value.
- Optionally, custom p-values can be given as input. In this case, no statistical test is performed, but corrections for multiple testing can be applied.
- It is also possible to hide non statistically significant annotations
- Any text can be used as annotation
- And various fixes (see CHANGELOG.md).
From version 0.3.0 on, the package is distributed on PyPi. The latest stable release (v0.6.0) can be downloaded and installed with:
pip install statannotationsconda install -c conda-forge statannotationsor, after cloning the repository,
pip install .

# OR, to have optional dependencies too (multiple comparisons & testing)
pip install -r requirements.txt .! Seaborn ≥ v0.12 and pandas 2 are not officially supported, we know there are at least some bugs. Issues can still be reported (and upvoted) in order to plan further development to support these versions. Also see discussion.
Here is a minimal example:
import seaborn as sns

from statannotations.Annotator import Annotator

df = sns.load_dataset("tips")
x = "day"
y = "total_bill"
order = ['Sun', 'Thur', 'Fri', 'Sat']

ax = sns.boxplot(data=df, x=x, y=y, order=order)

pairs=[("Thur", "Fri"), ("Thur", "Sat"), ("Fri", "Sun")]

annotator = Annotator(ax, pairs, data=df, x=x, y=y, order=order)
annotator.configure(test='Mann-Whitney', text_format='star', loc='outside')
annotator.apply_and_annotate()- Usage examples in a jupyter notebook usage/example.ipynb,
- A multipart step-by-step tutorial in a separate repository — First part here, also as a blog post on Medium.
- In-progress sphinx documentation in
/docs, available on https://statannotations.readthedocs.io/en/latest/index.html
- Python >= 3.6
- numpy >= 1.12.1
- seaborn >= 0.9,<0.12
- matplotlib >= 2.2.2
- pandas >= 0.23.0,<2.0.0
- scipy >= 1.1.0
- statsmodels (optional, for multiple testing corrections)
If you are using this work, please use the following information to cite it.
Bibtex
@software{florian_charlier_2022_7213391,
  author       = {Florian Charlier and
                  Marc Weber and
                  Dariusz Izak and
                  Emerson Harkin and
                  Marcin Magnus and
                  Joseph Lalli and
                  Louison Fresnais and
                  Matt Chan and
                  Nikolay Markov and
                  Oren Amsalem and
                  Sebastian Proost and
                  Agamemnon Krasoulis and
                  getzze and
                  Stefan Repplinger},
  title        = {Statannotations},
  month        = oct,
  year         = 2022,
  publisher    = {Zenodo},
  version      = {v0.6},
  doi          = {10.5281/zenodo.7213391},
  url          = {https://doi.org/10.5281/zenodo.7213391}
}
Example
Florian Charlier, Marc Weber, Dariusz Izak, Emerson Harkin, Marcin Magnus,
Joseph Lalli, Louison Fresnais, Matt Chan, Nikolay Markov, Oren Amsalem,
Sebastian Proost, Agamemnon Krasoulis, getzze, & Stefan Repplinger. (2022).
Statannotations (v0.6). Zenodo. https://doi.org/10.5281/zenodo.7213391
Opening issues and PRs are very much welcome! (preferably in that order).
In addition to git's history, contributions to statannotations are logged in
the changelog.
If you don't know where to start, there may be a few ideas in opened issues or
discussion, or something to work for the documentation.
NB: More on CONTRIBUTING.md


