Demo showing usage of Camunda, Java, SpringBoot, Kibana, Elaticsearch, Swagger, Docker, Ansible and Camel
In this demo I am simulating vindication process. I am showing how many money we managed to retrieve/lost due to debt on Kibana dashboard. I am also showing how many manual Camunda's processes there are currently. This manual process can be for example a task to send a letter to remind our client to pay his debt.
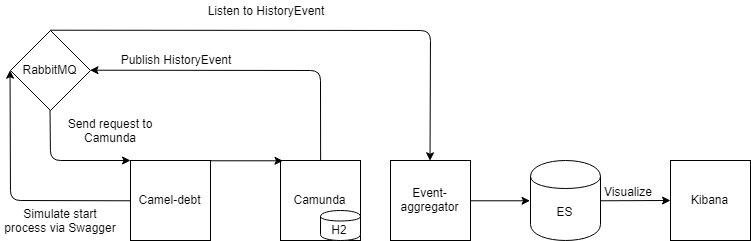
Architecture
1. Build apps in this order via mvn clena install
- camel-debt-collection
- camunda
- event-aggregator
2. Start on docker RabbitMQ
Command:
docker run -v rabbitmq-data:/var/lib/rabbitmq -d --hostname my-rabbit --name rabbit-demo -p 8090:15672 -p 5672:5672 rabbitmq:3-management
3. Configure RabbitMQ manually or via ansible
Configuring via ansible
If you want to configure it via ansible playbook - run the script on localhost that is located in "RabbitMQ\Config RabbitMQ via Ansible" directory.
ansible-playbook configureRabbitmq.yml
If problem occurs, try this command with sudo, or with --ask-sudo-pass option.
Configuring via RabbitMQ console
If you want to configure it via RabbitMQ console visit http://localhost:8090/#/queues Follow steps on screenshot that are located in "RabbitMQ\Config RabbitMQ via Rabbit Console" directory.
4. Start Elasticsearch and Kibana via docker
In "docker\Elasticsearch-Kibana" directory run:
docker-compose up
You can use -d option additionally if you prefer.
5. Start all spring-boot aplication: Camunda, Event-aggregator and Camel-debt-collection.
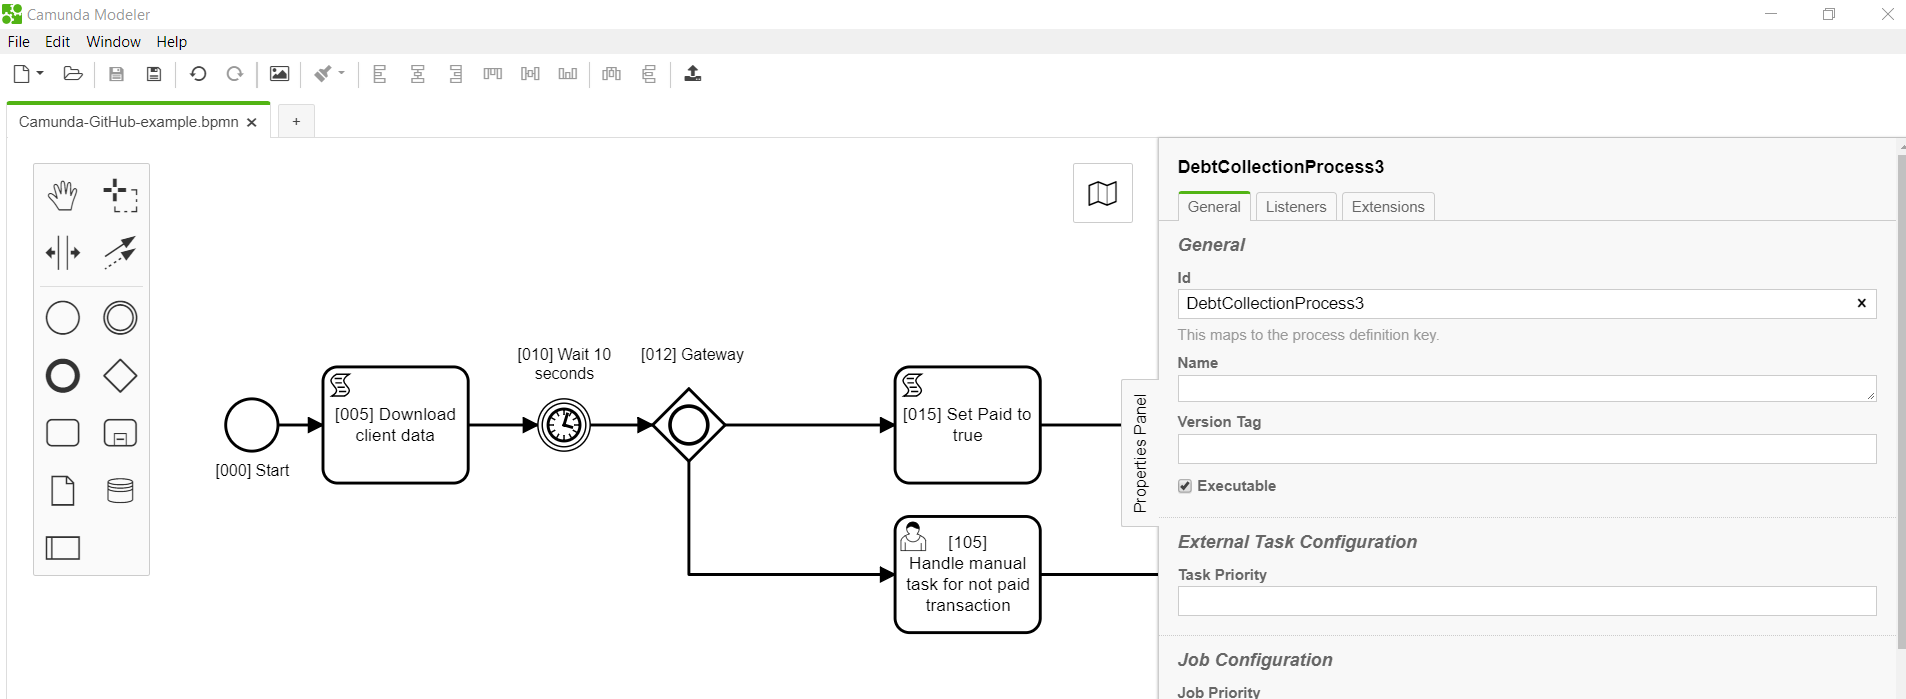
6. Upload BPMN diagram for Camunda
Diagram is located in main directory "Camunda-GitHub-example.bpmn" file.
You can upload it via "Camunda Modeller" desktop application via "Deploy Current Diagram" option.
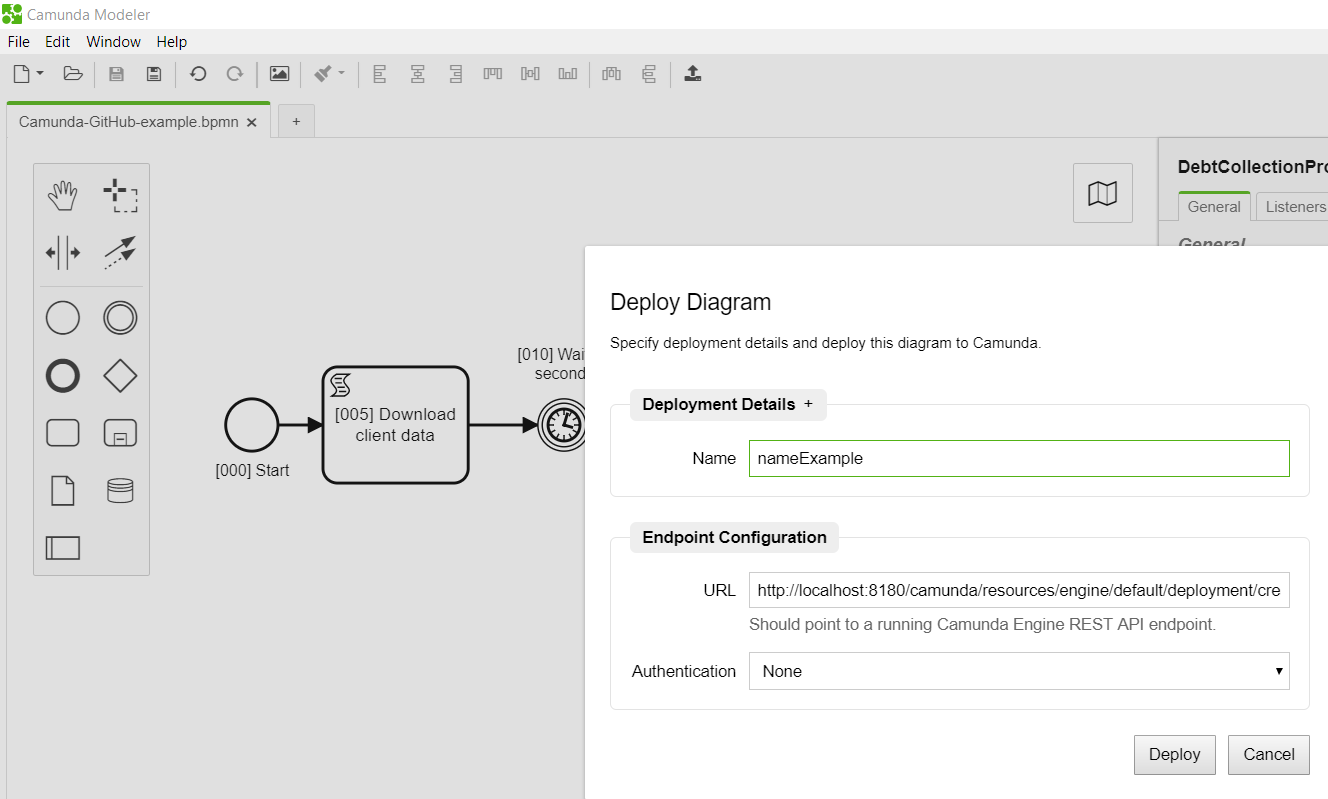
Name can be random.
Url should be: http://localhost:8180/camunda/resources/engine/default/deployment/create
Authentication: None
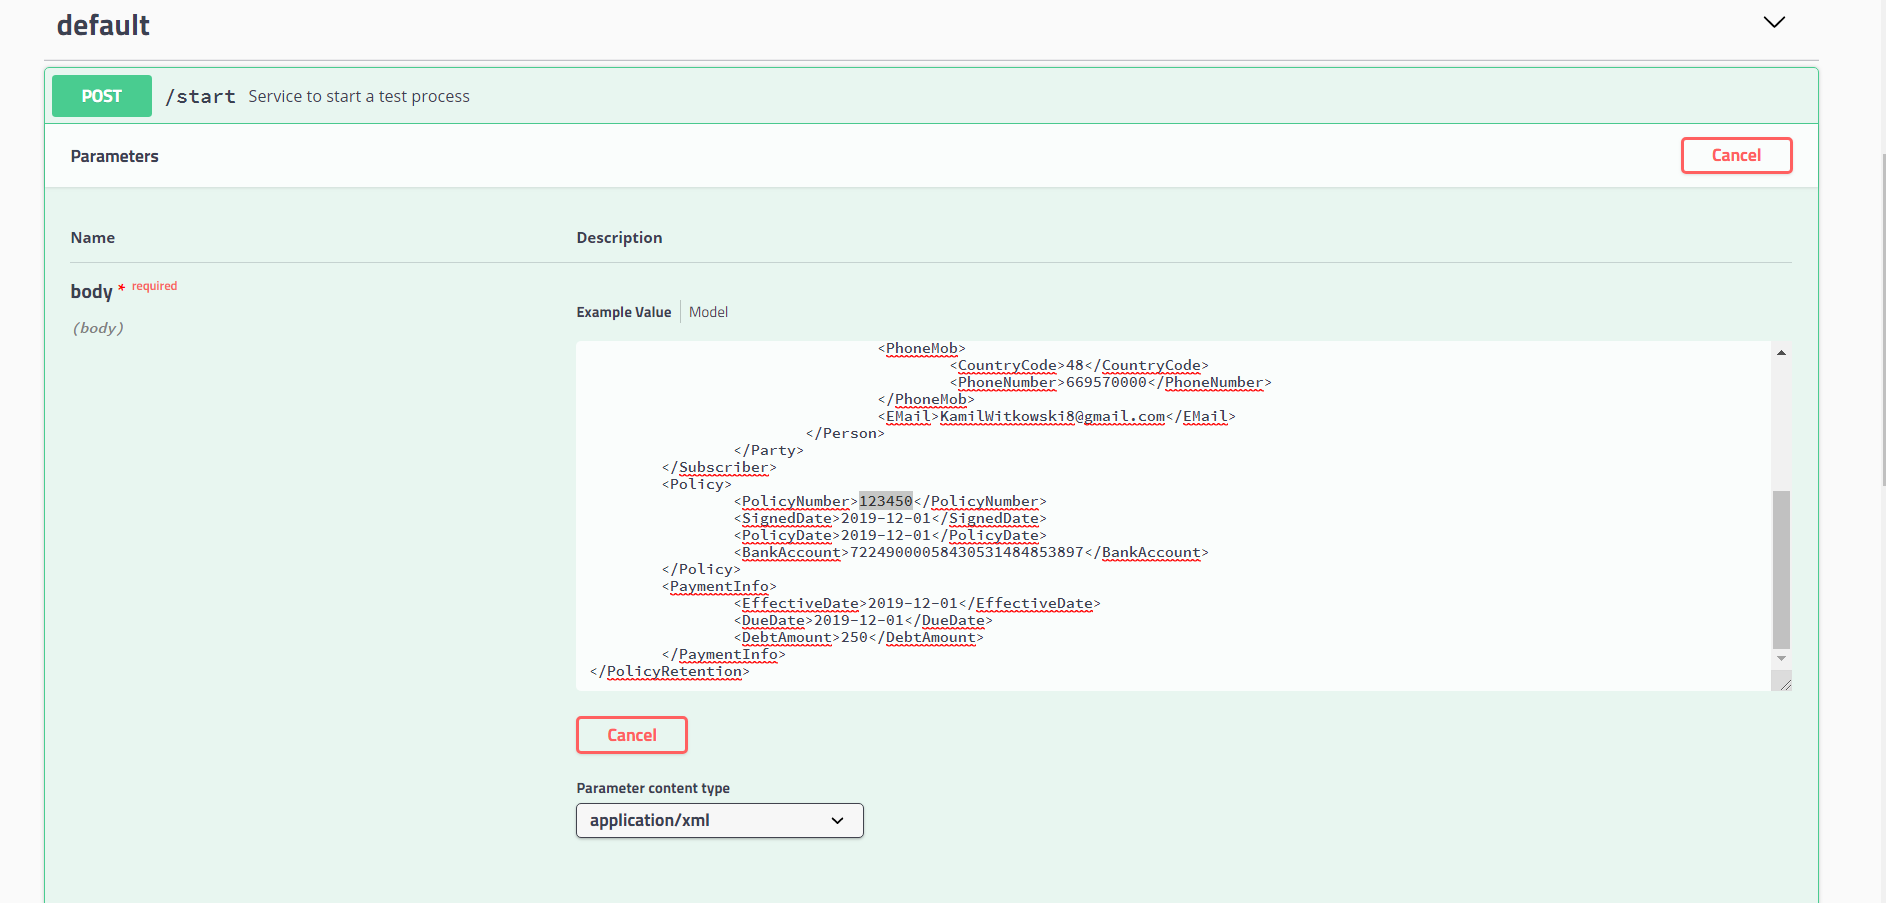
7. Prepare test data for Elasticsearch
Go to Swagger in browser: http://localhost:8087/camel-debt/swagger-ui.html#/default/REST You can send default request once.
8. Configure Kibana
In browser go to: http://localhost:5601/app/kibana#/management/kibana/objects?_g=() Select "Import" and choose "export.json" file located in "docker\Elasticsearch-Kibana" directory.
9. Watching the results
The BPMN process output differ upon is policyNumber ending with digit 0 or another one.
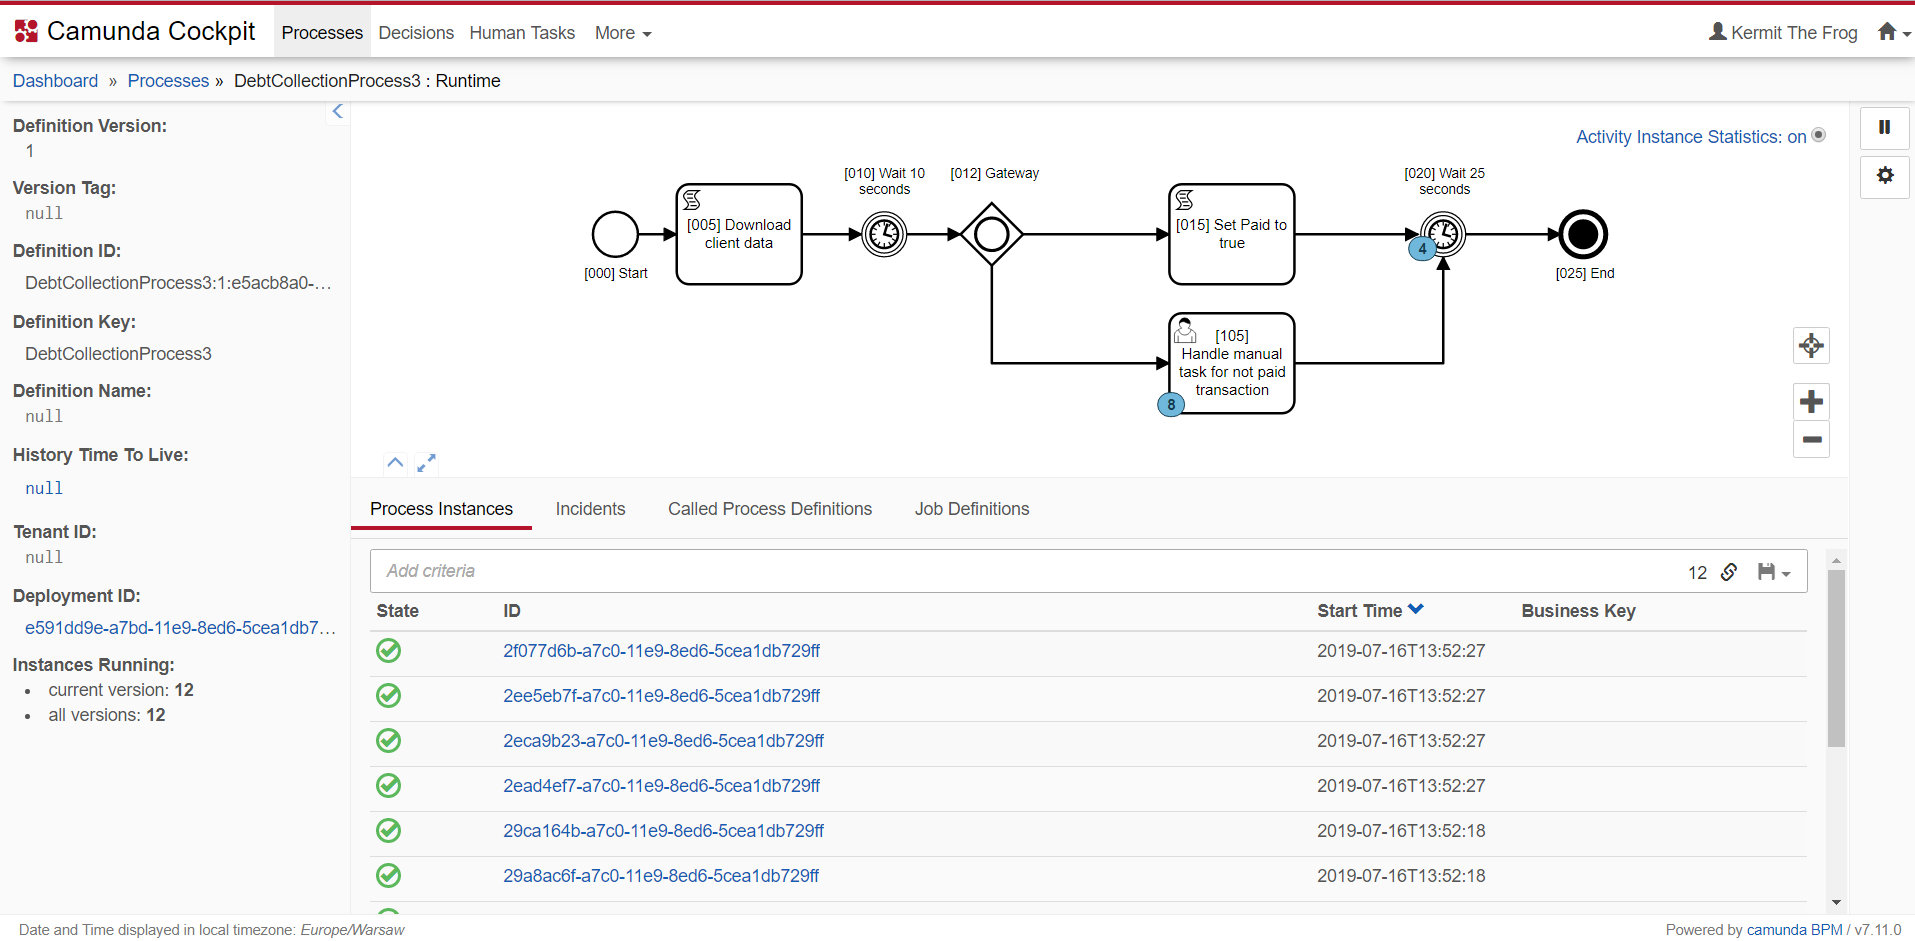
Camunda
To see what happens visit Camunda: http://localhost:8180/camunda (kermit/piggy) You then go to: http://localhost:8180/camunda/app/cockpit/default/#/processes
And select "DebtCollectionProcess3" - now you see every process currently executing.
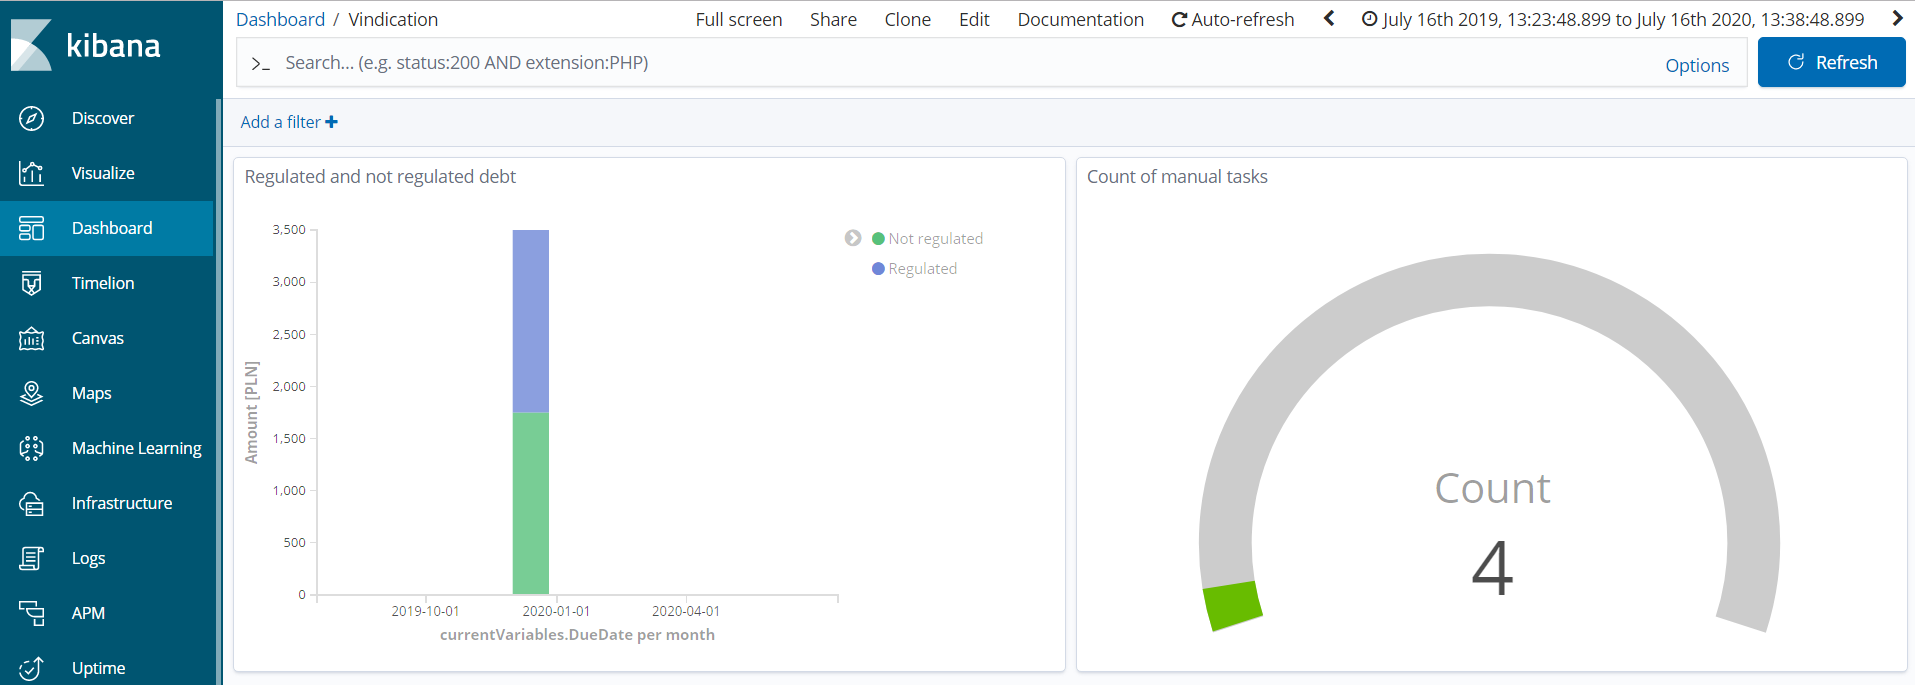
Kibana
Go to: http://localhost:5601/app/kibana#/dashboards?_g=()
select Vindication and change Kibana default time range in the upper right corner to Absolute from 2018 to 2020.
The visualization on left operates on DueDate param from camel-debt Swagger, by default it is
<DueDate>2019-12-01</DueDate>.
The visualization on right operates on "startTime" of process.