Skip to content

Mdraugelis/prettyplotlib


Repository files navigation

Build Status

prettyplotlib

Python matplotlib-enhancer library which painlessly creates beautiful default matplotlib plots. Inspired by Edward Tufte's work on information design and Cynthia Brewer's work on color perception.

I truly believe that scientific progress is impeded when improper data visualizations are used. I spent a lot of time tweaking my figures to make them more understandable, and realized the scientific world could be a better place if the default parameters for plotting libraries followed recent advances in information design research. And thus prettyplotlib was born.

Requirements:

  • matplotlib. Can be installed via pip install matplotlib or easy_install matplotlib
  • brewer2mpl. Can be installed via pip install brewer2mpl or easy_install brewer2mpl

Comparison to matplotlib

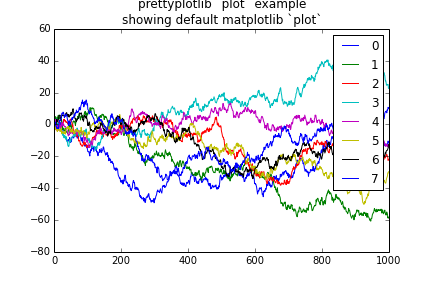
matplotlib default plot
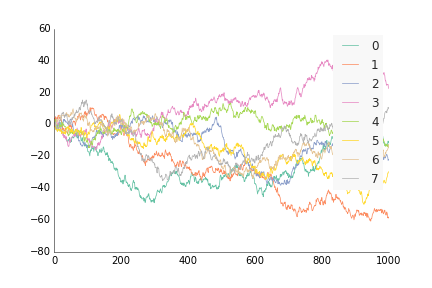
prettyplotlib default plot
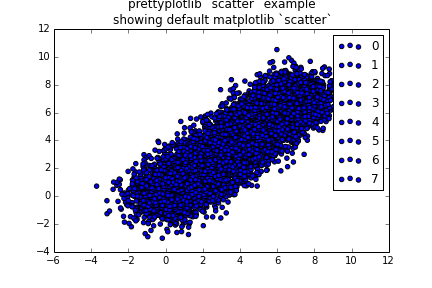
matplotlib default scatter
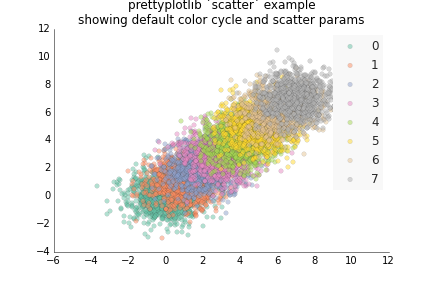
prettyplotlib default scatter
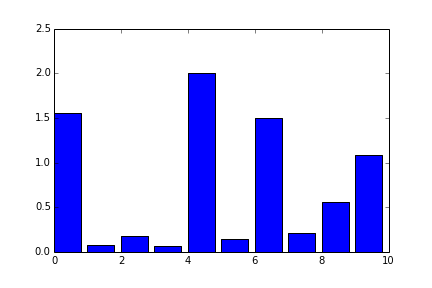
matplotlib default bar
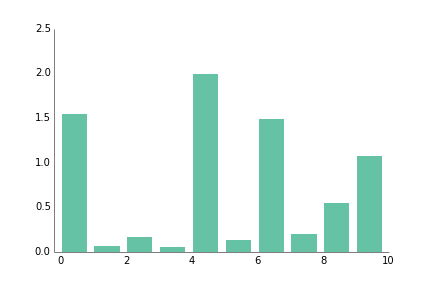
prettyplotlib default bar
matplotlib default hist
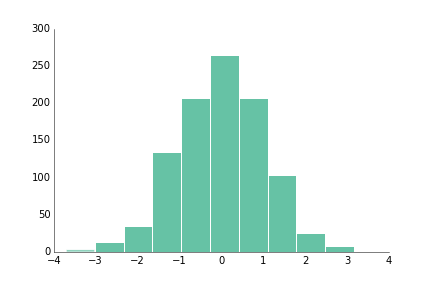
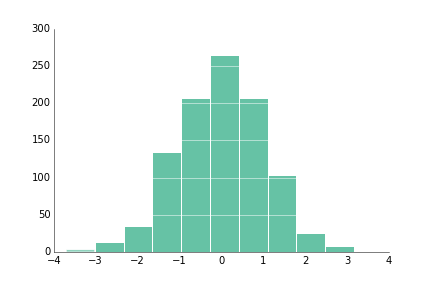
prettyplotlib default hist
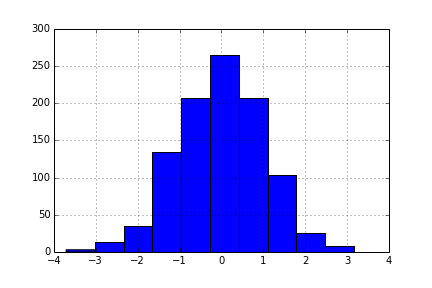
matplotlib default hist
with grid
prettyplotlib default hist
with grid
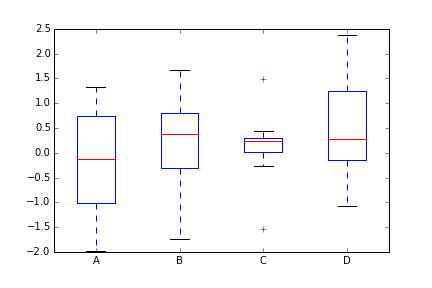
matplotlib default boxplot
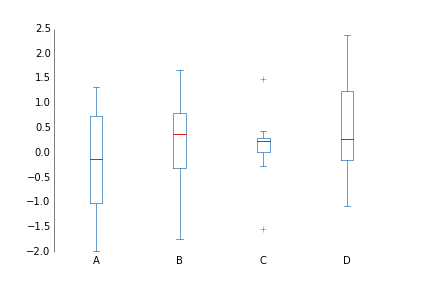
prettyplotlib default boxplot
matplotlib default pcolormesh
positive and negative data
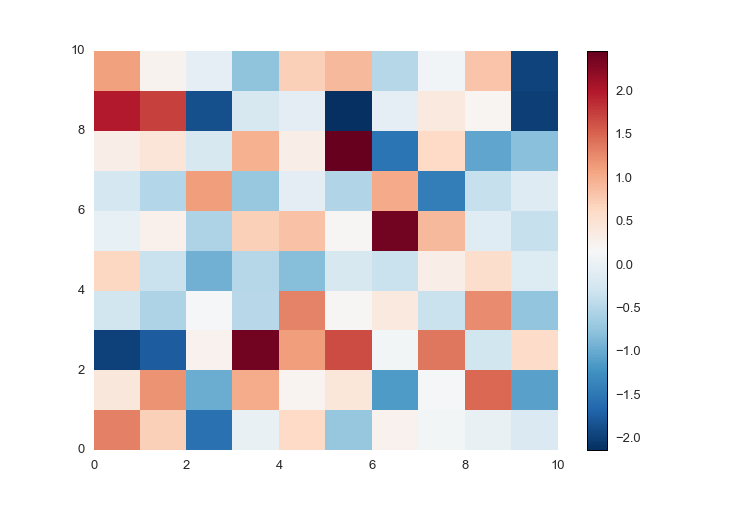
prettyplotlib default pcolormesh
positive and negative data
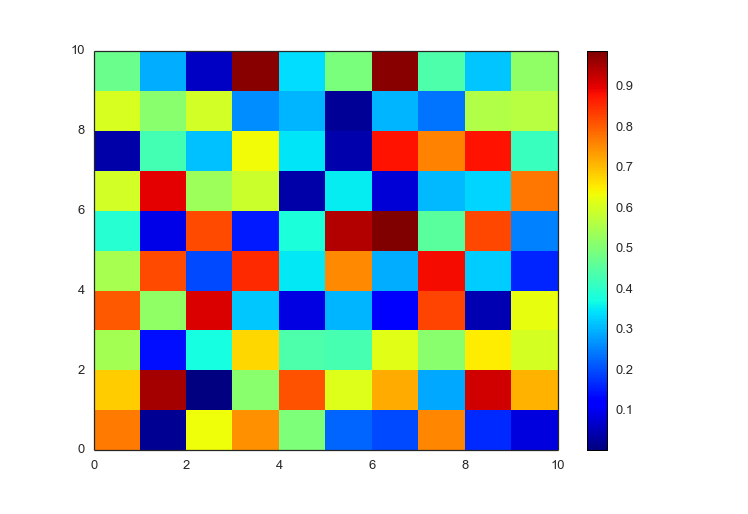
matplotlib default pcolormesh
positive data only
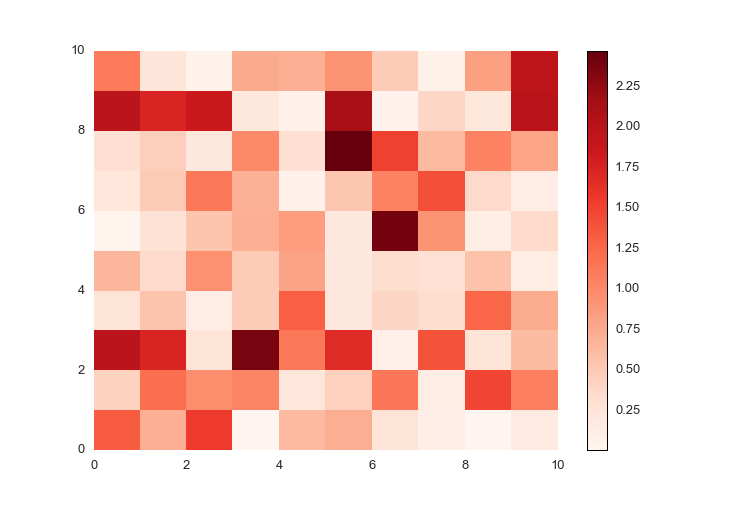
prettyplotlib default pcolormesh
positive data only
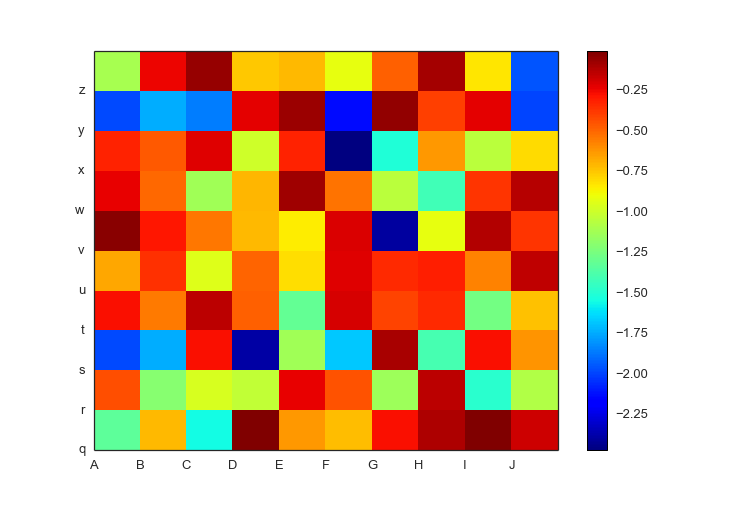
matplotlib pcolormesh
negative-valued data with labels
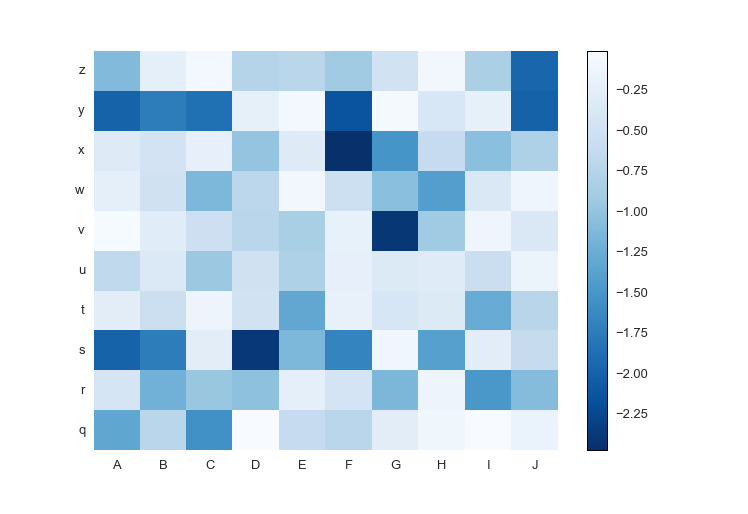
prettyplotlib pcolormesh
negative-valued data with labels

Quotes

"Dis ain't no uglyplotlib" - Anonymous

About

Painlessly create beautiful matplotlib plots.

Resources

License

Stars

Watchers

Forks

Releases

No releases published

Packages

No packages published