
| Latest Lets-Plot Kotlin API Version |

|
| Latest Lets-Plot Version |

|
| License |
|
Lets-Plot for Kotlin is a Kotlin API for the Lets-Plot library - an open-source plotting library for statistical data which is written entirely in the Kotlin programming language.
Lets-Plot Kotlin API is built on the principals of layered graphics first described in the Leland Wilkinson work The Grammar of Graphics and later implemented in the ggplot2 package for R.
This grammar [...] is made up of a set of independent components that can be composed in many different ways. This makes [it] very powerful because you are not limited to a set of pre-specified graphics, but you can create new graphics that are precisely tailored for your problem.
- Hadley Wickham, "ggplot2: Elegant Graphics for Data Analysis"
Read Lets-Plot Usage Guide for quick introduction to the Grammar of Graphics and Lets-Plot Kotlin API.
In Jupyter notebook with a Kotlin Kernel, Lets-Plot library is available out-of-the-box. To install Kotlin Kernel and OpenJDK into a Conda environment, run the following command:
conda install kotlin-jupyter-kernel -c jetbrainsFor more information about Jupyter Kotlin kernel, see the Kotlin kernel for Jupyter/iPython project.
-
In Jupyter, create a new notebook and choose the Kotlin kernel (see the instructions for more details on how to select a kernel).
-
Add the following code to a Jupyter notebook:
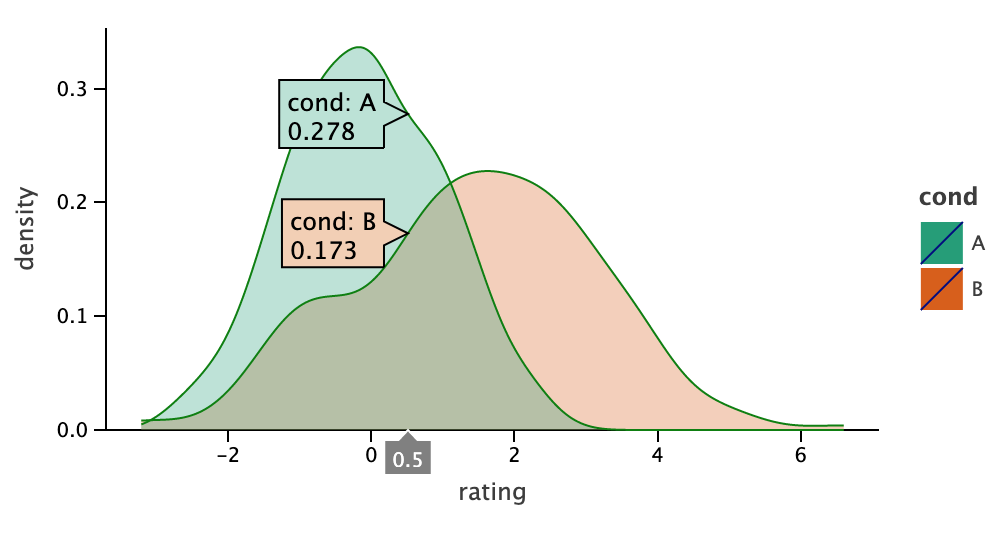
%use lets-plot
val rand = java.util.Random()
val data = mapOf<String, Any>(
    "rating" to List(200) { rand.nextGaussian() } + List(200) { rand.nextGaussian() * 1.5 + 1.5 },
    "cond" to List(200) { "A" } + List(200) { "B" }
)

var p = lets_plot(data)
p += geom_density(color="dark_green", alpha=.3) {x="rating"; fill="cond"}
p + ggsize(500, 250)
- Execute the added code to evaluate the plotting capabilities of Lets-Plot.
Try the following examples to study features of the Lets-Plot library.
- Kotlin for Data Science : overview of Kotlin Jupyter kernel etc.
- Using Kotlin for Data Science : recording of the talk at KotlinConf-19.
Datalore is an online data science notebook by JetBrains.
In Datalore notebook you can run Kotlin code directly in your browser. Many popular Kotlin libraries are preinstalled and readily available (see the list of supported Kotlin libraries).
See Quickstart in Datalore example notebook to learn more about Kotlin support in Datalore.
Watch the Datalore Getting Started Tutorial video for a quick introduction to Datalore.
Apart from Jupyter notebooks, Lets-Plot library and Kotlin API enables embedding plots into a JVM-based application.
See README_DEV.md to learn more about creating plots in a JVM environment.
-
The User Guide in the form of Jupyter notebook: user_guide.ipynb
-
Lets-Plot Kotlin API reference.
Sampling is a special technique of data transformation, which helps to deal with large datasets and overplotting.
Learn more about sampling in Lets-Plot.
GGBunch allows to show a collection of plots on one figure. Each plot in the collection can have arbitrary location and size. There is no automatic layout inside the bunch.
Examples:
The ggsave() function is a convenient way of saving a plot or a GGBunch object to a file.
The supported export formats are: SVG, HTML, PNG, JPEG and TIFF.
For example, the code below will save plot as a PNG image to the file <user dir>//lets-plot-images/density.png:
%use lets-plot

val rand = java.util.Random(123)
val n = 400
val data = mapOf (
    "rating" to List(n/2) { rand.nextGaussian() } + List(n/2) { rand.nextGaussian() * 1.5 + 1.5 },
    "cond" to List(n/2) { "A" } + List(n/2) { "B" }
)

var p = lets_plot(data) +
        geom_density { x = "rating"; color = "cond" } + ggsize(500, 250)

ggsave(p, "density.png")
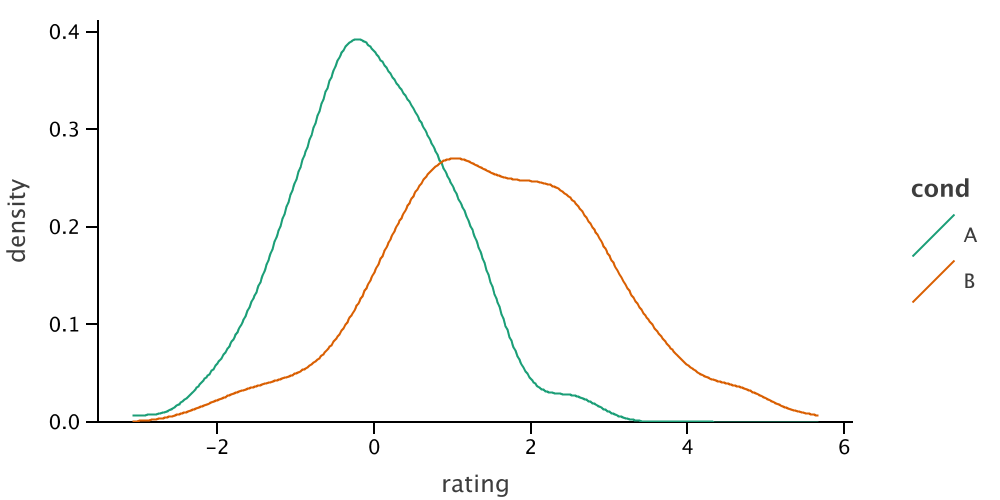
See ggsave documentation for more information about the function arguments and default values.
Maven artifact group id has changed in this release.
Now it is: org.jetbrains.lets-plot-kotlin (before was: org.jetbrains.lets-plot).
To include Lets-Plot Kotlin API to your Gradle project for example, use the following dependency:
dependencies {
    api "org.jetbrains.lets-plot-kotlin:lets-plot-kotlin-api:<api version>"
}See CHANGELOG.md.
Code and documentation released under the MIT license. Copyright © 2019-2020, JetBrains s.r.o.