Predict survival on the Titanic and get familiar with ML basics. ( ⭐️ Star us on GitHub — it helps! )
Getting started with competitive data science can be quite intimidating. So I build this notebook for quick overview on Titanic: Machine Learning from Disaster competition.
For your convenience, please view it in kaggle.
I encourage you to fork this kernel/GitHub repo, play with the code and enter the competition. Good luck!
This project requires Python 2.7 and the following Python libraries installed:
You will also need to have the software installed to run and execute an iPython Notebook
An ipython notebook is used for data preprocessing, feature transforming and outlier detecting. All core scripts are in file .ipynb" folder. All input data are in input folder and the detailed description of the data can be found in Kaggle.
K Fold Cross Validation: Using 5-fold cross-validation.
First Level Learning Model: On each run of cross-validation tried fitting following models :-
- Random Forest classifier
- Extra Trees classifier
- AdaBoost classifer
- Gradient Boosting classifer
- Support Vector Machine
Second Level Learning Model : Trained a XGBClassifier using xgboost
- Data Preprocessing
- Exploratory Visualization
- Feature Engineering
- Value Mapping
- Simplification
- Feature Selection
- Handling Categorical Data
- Modeling & Evaluation
- Trying Different Model without Validation
- Cross-validation method
- Model scoring function
- Setting Up Models
- Train & Fit Model
- Our Base First-Level Models
- Second-Level Predictions From The First-Level Output
- Output as Prediction file ( .csv)
- Acknowledgments
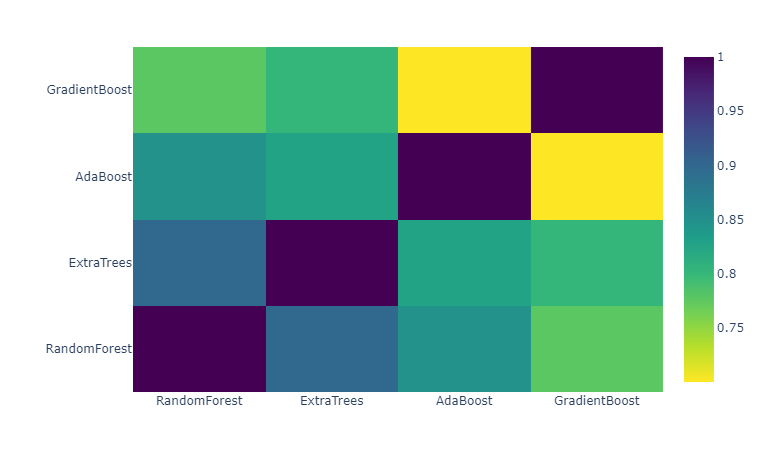
The modal comparison with cross validation for first output layer :

The final price prediction for each house is present in the output folder as a .csv file. The final model used for scoring is hypertuned XGBoost Classifier with Cross Validation.
The final XGBoost Classifier can be viewed as :

Rohit Kumar Singh (IIT Bombay)
Feel free to send us feedback on file an issue. Feature requests are always welcome. If you wish to contribute, please take a quick look at the kaggle.
Inspirations are drawn from various Kaggle notebooks but majorly motivation is from the following :
- https://www.kaggle.com/arthurtok/0-808-with-simple-stacking
- https://www.kaggle.com/usharengaraju/data-visualization-titanic-survival
- https://www.kaggle.com/arthurtok/introduction-to-ensembling-stacking-in-python
- https://www.kaggle.com/startupsci/titanic-data-science-solutions
Credit for image to https://miro.medium.com/
Written with StackEdit.

