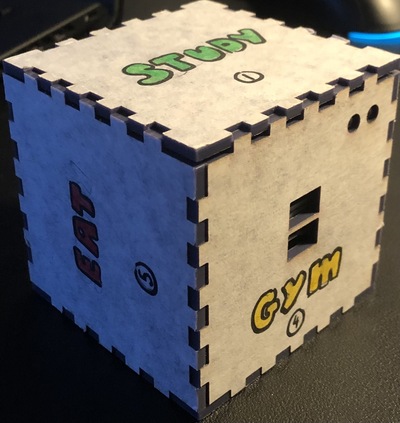
Description: DIY Timular time block is an IoT device that help users keep track of time spent on different activities by associating each different side of the block with a corresponding activity. When changes in orientation is detected by the MPU-6050 Accelerometer, the time block will send an API request to Clockify.com time tracking service using an ESP32 development board to start or stop a timer associated with the current activity that is represented by whichever side of the cube is facing up.
The action of recording time is automatic depending on which side is facing upward, and to stop the current running timer, the user will give the time block a nice shake and another one to resume the time tracking process. There will be 2 LEDs for user indication. The white LED is lit up when the block is successfully connected to Wifi, or when the cube changed from stop recording to start recording. The red LED will be blinking when the cube is trying to connect to WiFi, or stay on when the cube is current in no-recording mode.
Original Design Concepts: 📝📝 Initially, project Time Block consist of 3 component:
- Arduino IoT Device
- Database
- Web Application

IoT Device: At the early stage of development, the first component, which is the IoT device, consist of two main component: The microcontroller/WiFi module ESP32-WROOM-32 and the MPU-6050 accelerometer. For the first week, I was getting familiar with the two modules while also exploring different approaches in how to send and what to send in term of data to the database to achieve my goal. At the end of milestone 1, which is to get the hardware ready for data transfer to the cloud, I successfully programmed the accelerometer to track the orientation of the cube and recognize which side is facing up. Since the cube has 6 sides, I created 6 variables side1 to side6 and assign value of 1 to the sides that is up while 0 to the others. I bunch up the variable into a JSON file for transfer, and create a publish message function to send data to AWS IoT Core via MQTT messaging. Since constantly uploading data not only maintainable but also uses a large amount of resources that a free AWS account cannot provide, the IoT device is implemented so that it send data when and only when there is a change in side orientation.
AWS Database Services: With the IoT device capable of uploading data with AWS IoT Core via MQTT messaging, I now use the same process created by Stephen Borsay to implement a Serverless Asynchornous IoT Dashboard with WebSockets. The idea is that everytime a payload is published to a topic in IoT Core, it then triggers an AWS Lambda function to extract that data and use the Amazon API Gateway to send the extracted data to the website hosted in AWS S3 Bucket as the diagram above. The onMessage Lambda function is used to grab information such as connection ID everytime a connection is established, thus making the process asynchronous. Learning various AWS services tooks a week and a half, and it takes a bit more time to modify the design from the Stephen's design process to what I wanted to achieve
Web Application: What I wanted to do with the software side of the project was to build a calendar web app from scratch, which will pull data from various sources for current date, time, etc. and store various timer in a AWS database.

IoT Device: In the experimental stage, there are no changes in the IoT Device design.
AWS Database Service: Due to the huge learning in getting adept to each of the AWS services as I was 2 week in without being able to set up database to store time, date and other essential information for a calendar web app from scratch, I decided to simplify the software side and simple create a React web app that has bar graph of the time spent on different activities. The React web app will graph data from AWS IoT Core by subscribing to the same topic that is published via MQTT messaging without the need to store them in any database since it will he handle by the javascript web app
React Web App: The focus shift from a calendar web app to a dashboard displaying bar graph of time spent on different activities

Final Approach: I soon realized that the result from scratch was not as exiciting compared to the amount of work that was being put in. I decided to steer the focus back to having the original goal of a calendar view and time block demonstrating time spent on activities instead of simple bar graph. But instead of reinventing the wheel, I used an already existing web app called Clockify and use a more direct approach. Once the time cube detect a change in whichever side is on top, only then will it send an HTTP Request to the Clockify website via its REST API. There are two main request that the time cube is sending: start timer and stop timer. This way, we are able to achieve aesthetic visualization of data while not having to deal with any backend element at all. After 3 trial, we finally found best direct approach to achieve our goal.

As we can see from the picture above, the first protoype was created and the purpose is to achieve precise reading of which side is facing up and printing on Serial Monitor the right result.
 For software verification, I used Postman API Platform to simulate sending HTTPs Request to verify that the structure of the JSON payload is valid to trigger add time entry and stop timer functionality of Clockify. From the picture above, a GET HTTPS request was sent to get all workspace information including the workspace ID and all of the activitiy ID for the JSON payload file. By sending GET request like this, I was able to obtain essential information to fill in the sample request template specified by Clockify API:

This is what a JSON payload structure that will be sent to Clockify will look like, and our goal is to implement a function that construct a JSON payload that have this structure with all the necessary information filled in, which is obtainable by using Postman API.
Final Design Overview: After creating the enclosure after measuring, the final design is ready to be put together. With the vision of time block being a stand-alone device, I decided to add two component: An HiLetgo TP4056 Lithium Battery Charging Module and a Lithium Ion Battery Pack. The design configuration is demonstrated below:

At power up, Time Block will begin searching for the wifi by accessing the Wifi-ssid and the Wifi-password in the Arduino sketch file indicated by the blinking red light. After successful connection, the red blinking stop and the white light will be on, the MPU-6050 will be initialize and the whichever side is facing upward, it will registered as detected and send a HTTPs Request to Clockify and begin the timer for the associated activity. If the user want to stop the current running timer, they will pick up the cube and give it a good shake. The timer on the website will be stop and be indicated by the red light. The light will stay red indicating that the cube is currently not in recording mode, and only start recording again when there is another shake and the white light turn on.
- Wifi Testing: WiFi connection testing was done by observing the behavior of the LEDs as well as checking in Serial Monitor
- MPU-6050 Testing: Orientation testing was done by printing the side onto the Serial Monitor

* Video Demonstration: https://youtu.be/Tgg8CX6MwBA
This assignment has help me a lot in gaining experience with cloud development and IoT device in general. It was a great exposure to AWS services and the ESP32 WiFi module. Even though the final product is a rough draft, the functionality prove to be quite useful. Yet if I were to do another design iteration, there are many aspect that needs to be improved. The two LEDs were not adequate enough as indication for users to see. The product in the future would most likely need something more such as an LCD screen or an audio indication to specify whether if connection failed, reconnecting to WiFi, or other states. Another thing that could be improved is the functinality to reconnect to WiFi if connection is lost or disrupted. Last but not least, there are a lot more could be done to the enclosure to improve the aesthetic of the product. Nevertheless, it was a great experience working on this final project and many valuable lessons were learned throughout the process.