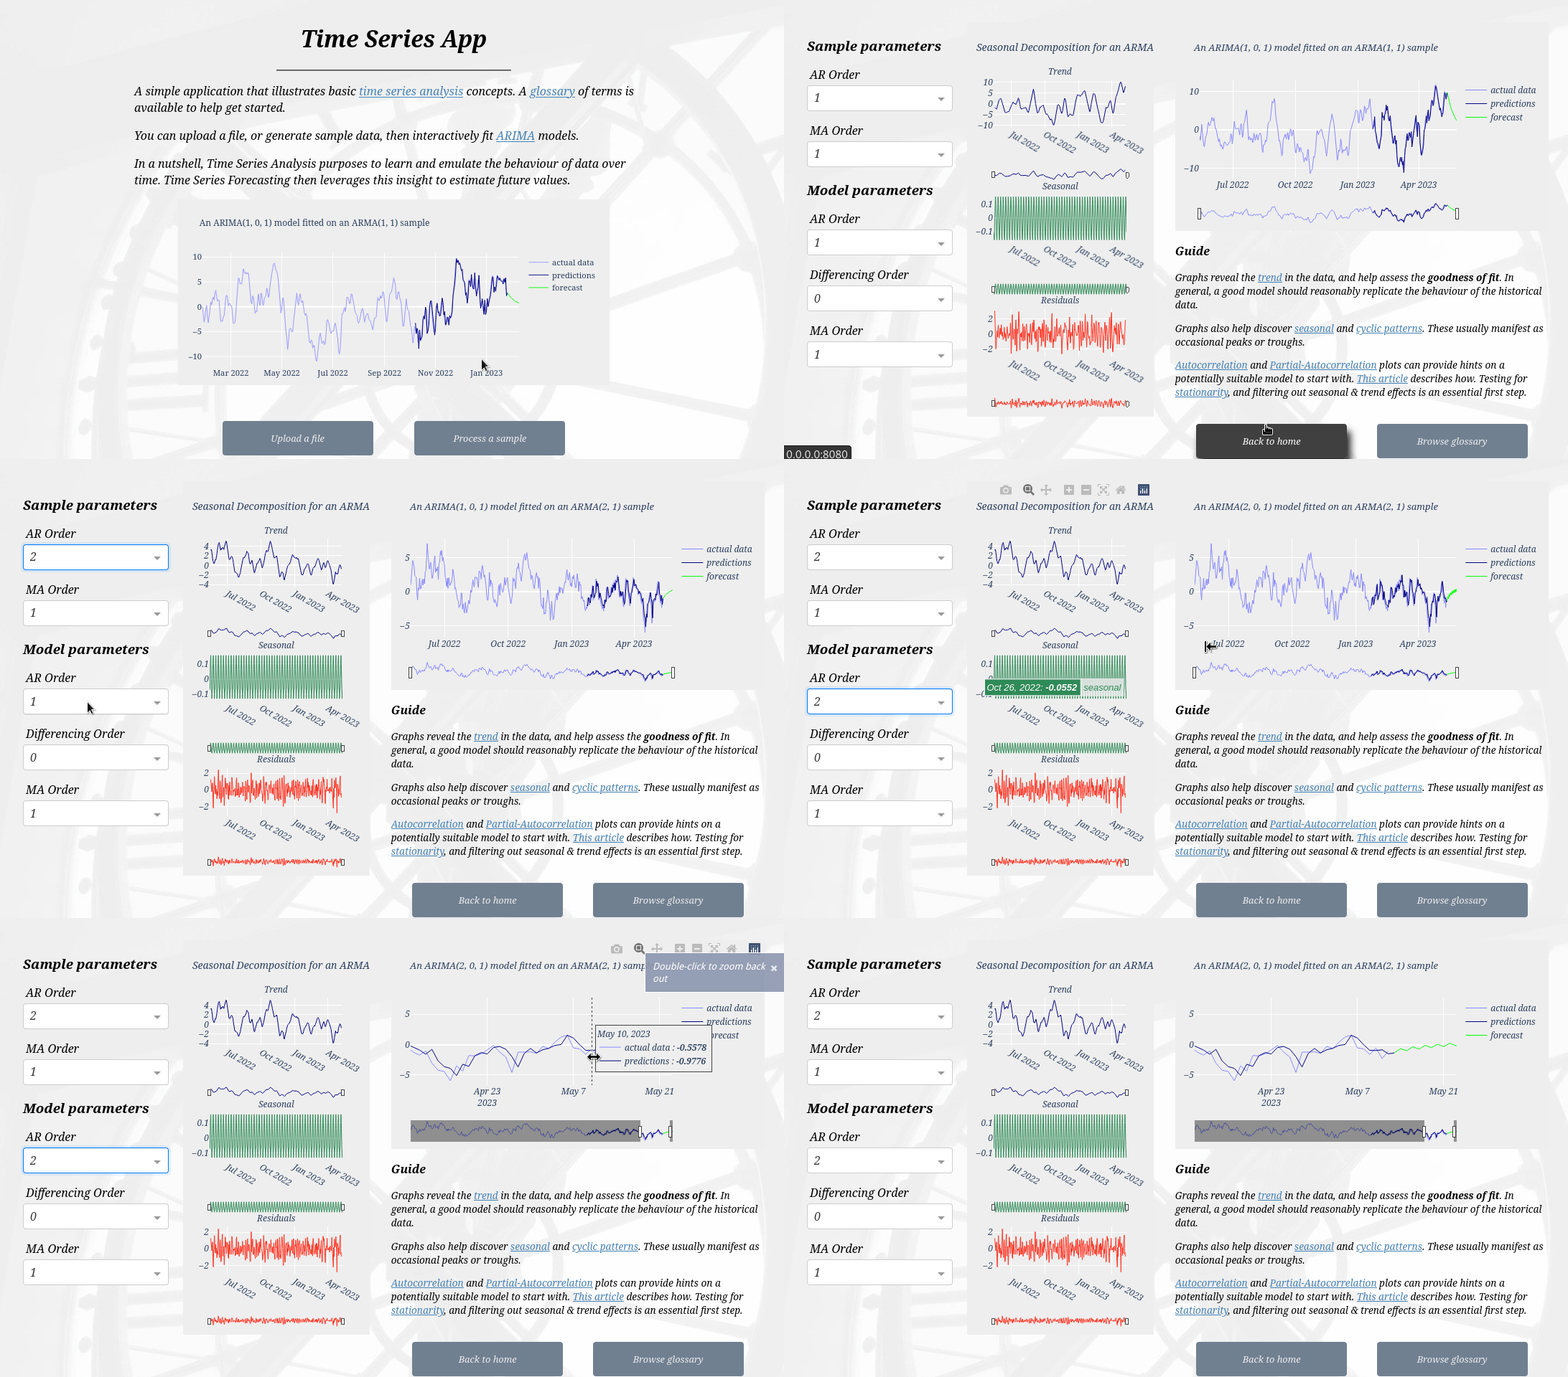
A dashboard application to help learn a little about, and apply Time Series analysis & forecasting concepts.
You can create a sample, or upload a file, and interactively fit a time series model on it.
The dashboard is built with Dash, and the time series models are fitted using Statsmodels.
You can try it out here, courtesy of Render.
NOTE: Free-hosted apps on Render might take a while to load since they are shut down when not in use.
The easiest way to get the app is from PyPI:
pip install ts-appThe command ts_app launches the app:
$ ts_app -h
usage: ts_app [-h] [-p PORT] [--host HOST] [--no-browser]

A simple dashboard application to learn time series basics and interactively fit ARIMA models.

optional arguments:
  -h, --help            show this help message and exit
  -p PORT, --port PORT  The TCP port on which to listen (default: 8000).
  --host HOST           A host-name or IP address (default: 'localhost').
  --no-browser          Avoid openning a browser tab or window.
You can also start the app from an interactive session:
>>> import ts_app
>>> ts_app.run_app()
Afterwards, press CTRL + C to stop the server.
