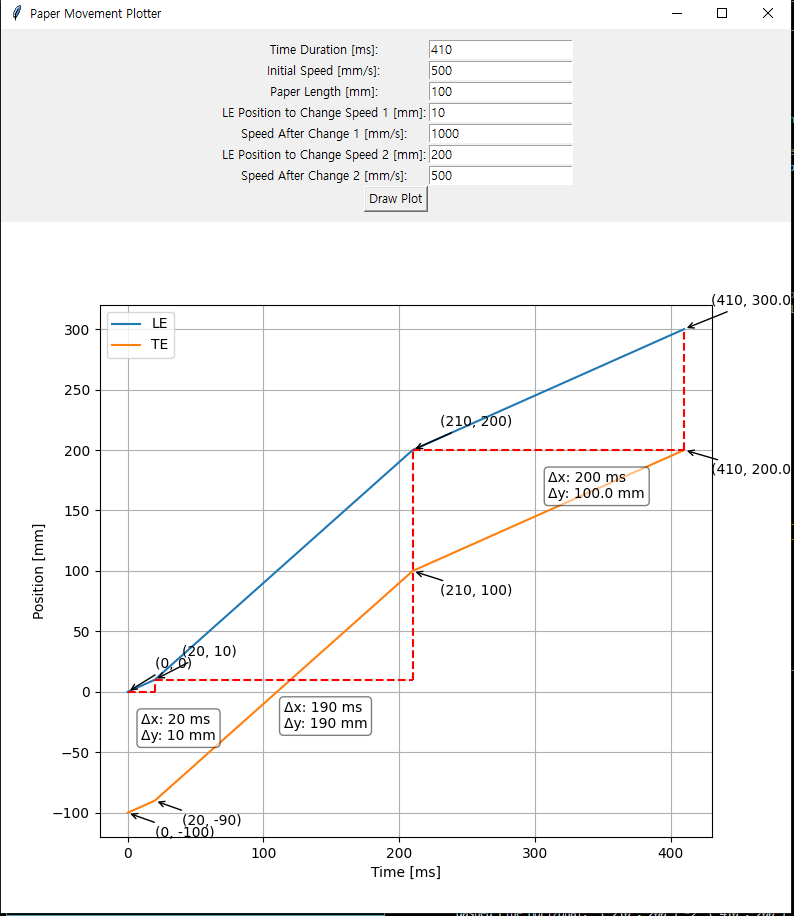
This repository contains a Python script that uses tkinter and matplotlib to create an interactive application for plotting the movement of a paper in a paper machine. The user can input various parameters, such as time duration, initial speed, paper length, and specific points for speed changes. The script calculates the position of the leading edge (LE) and trailing edge (TE) of the paper over time and displays the resulting plot. The plot also includes annotations for the change points, as well as the differences in position and time between these points.
(example)
GUI :
Log :

// ******************** //
// ****** Start ******* //
// ******************** //
Y_points given =  [0, 10, 200]
speeds given =  [0, 500, 1000, 500]
         prev = ( 0 , 0 )
         Y =  10 , speed =  500 -> X =  20
         next = ( 20 , 10 )


         prev = ( 20 , 10 )
         Y =  200 , speed =  1000 -> X =  210
         next = ( 210 , 200 )


3-0. X_points =  [0, 20, 210, 410]
3-1. Y_points =  [0, 10, 200]
4. lastY =  300.0  =  200 + 410 * 500 /1000
5-0. X_points =  [0, 20, 210, 410]
5-1. Y_points =  [0, 10, 200, 300.0]
6. le_points =
 [[  0.   0.]
 [ 20.  10.]
 [210. 200.]
 [410. 300.]]
7. te_points =
 [[   0. -100.]
 [  20.  -90.]
 [ 210.  100.]
 [ 410.  200.]]
Loop # 0 X_cur = X =  0
Loop # 1 X_cur = X =  20
         dashed Line Horizonal:  ( 0 , 0 ) ->  ( 20 , 0 )
         dashed Line Verical:  ( 20 , 0 ) ->  ( 20 , 10 )
Loop # 2 X_cur = X =  210
         dashed Line Horizonal:  ( 20 , 10 ) ->  ( 210 , 10 )
         dashed Line Verical:  ( 210 , 10 ) ->  ( 210 , 200 )
Loop # 3 X_cur = X =  410
         dashed Line Horizonal:  ( 210 , 200 ) ->  ( 410 , 200 )
         dashed Line Verical:  ( 410 , 200 ) ->  ( 410 , 300.0 )