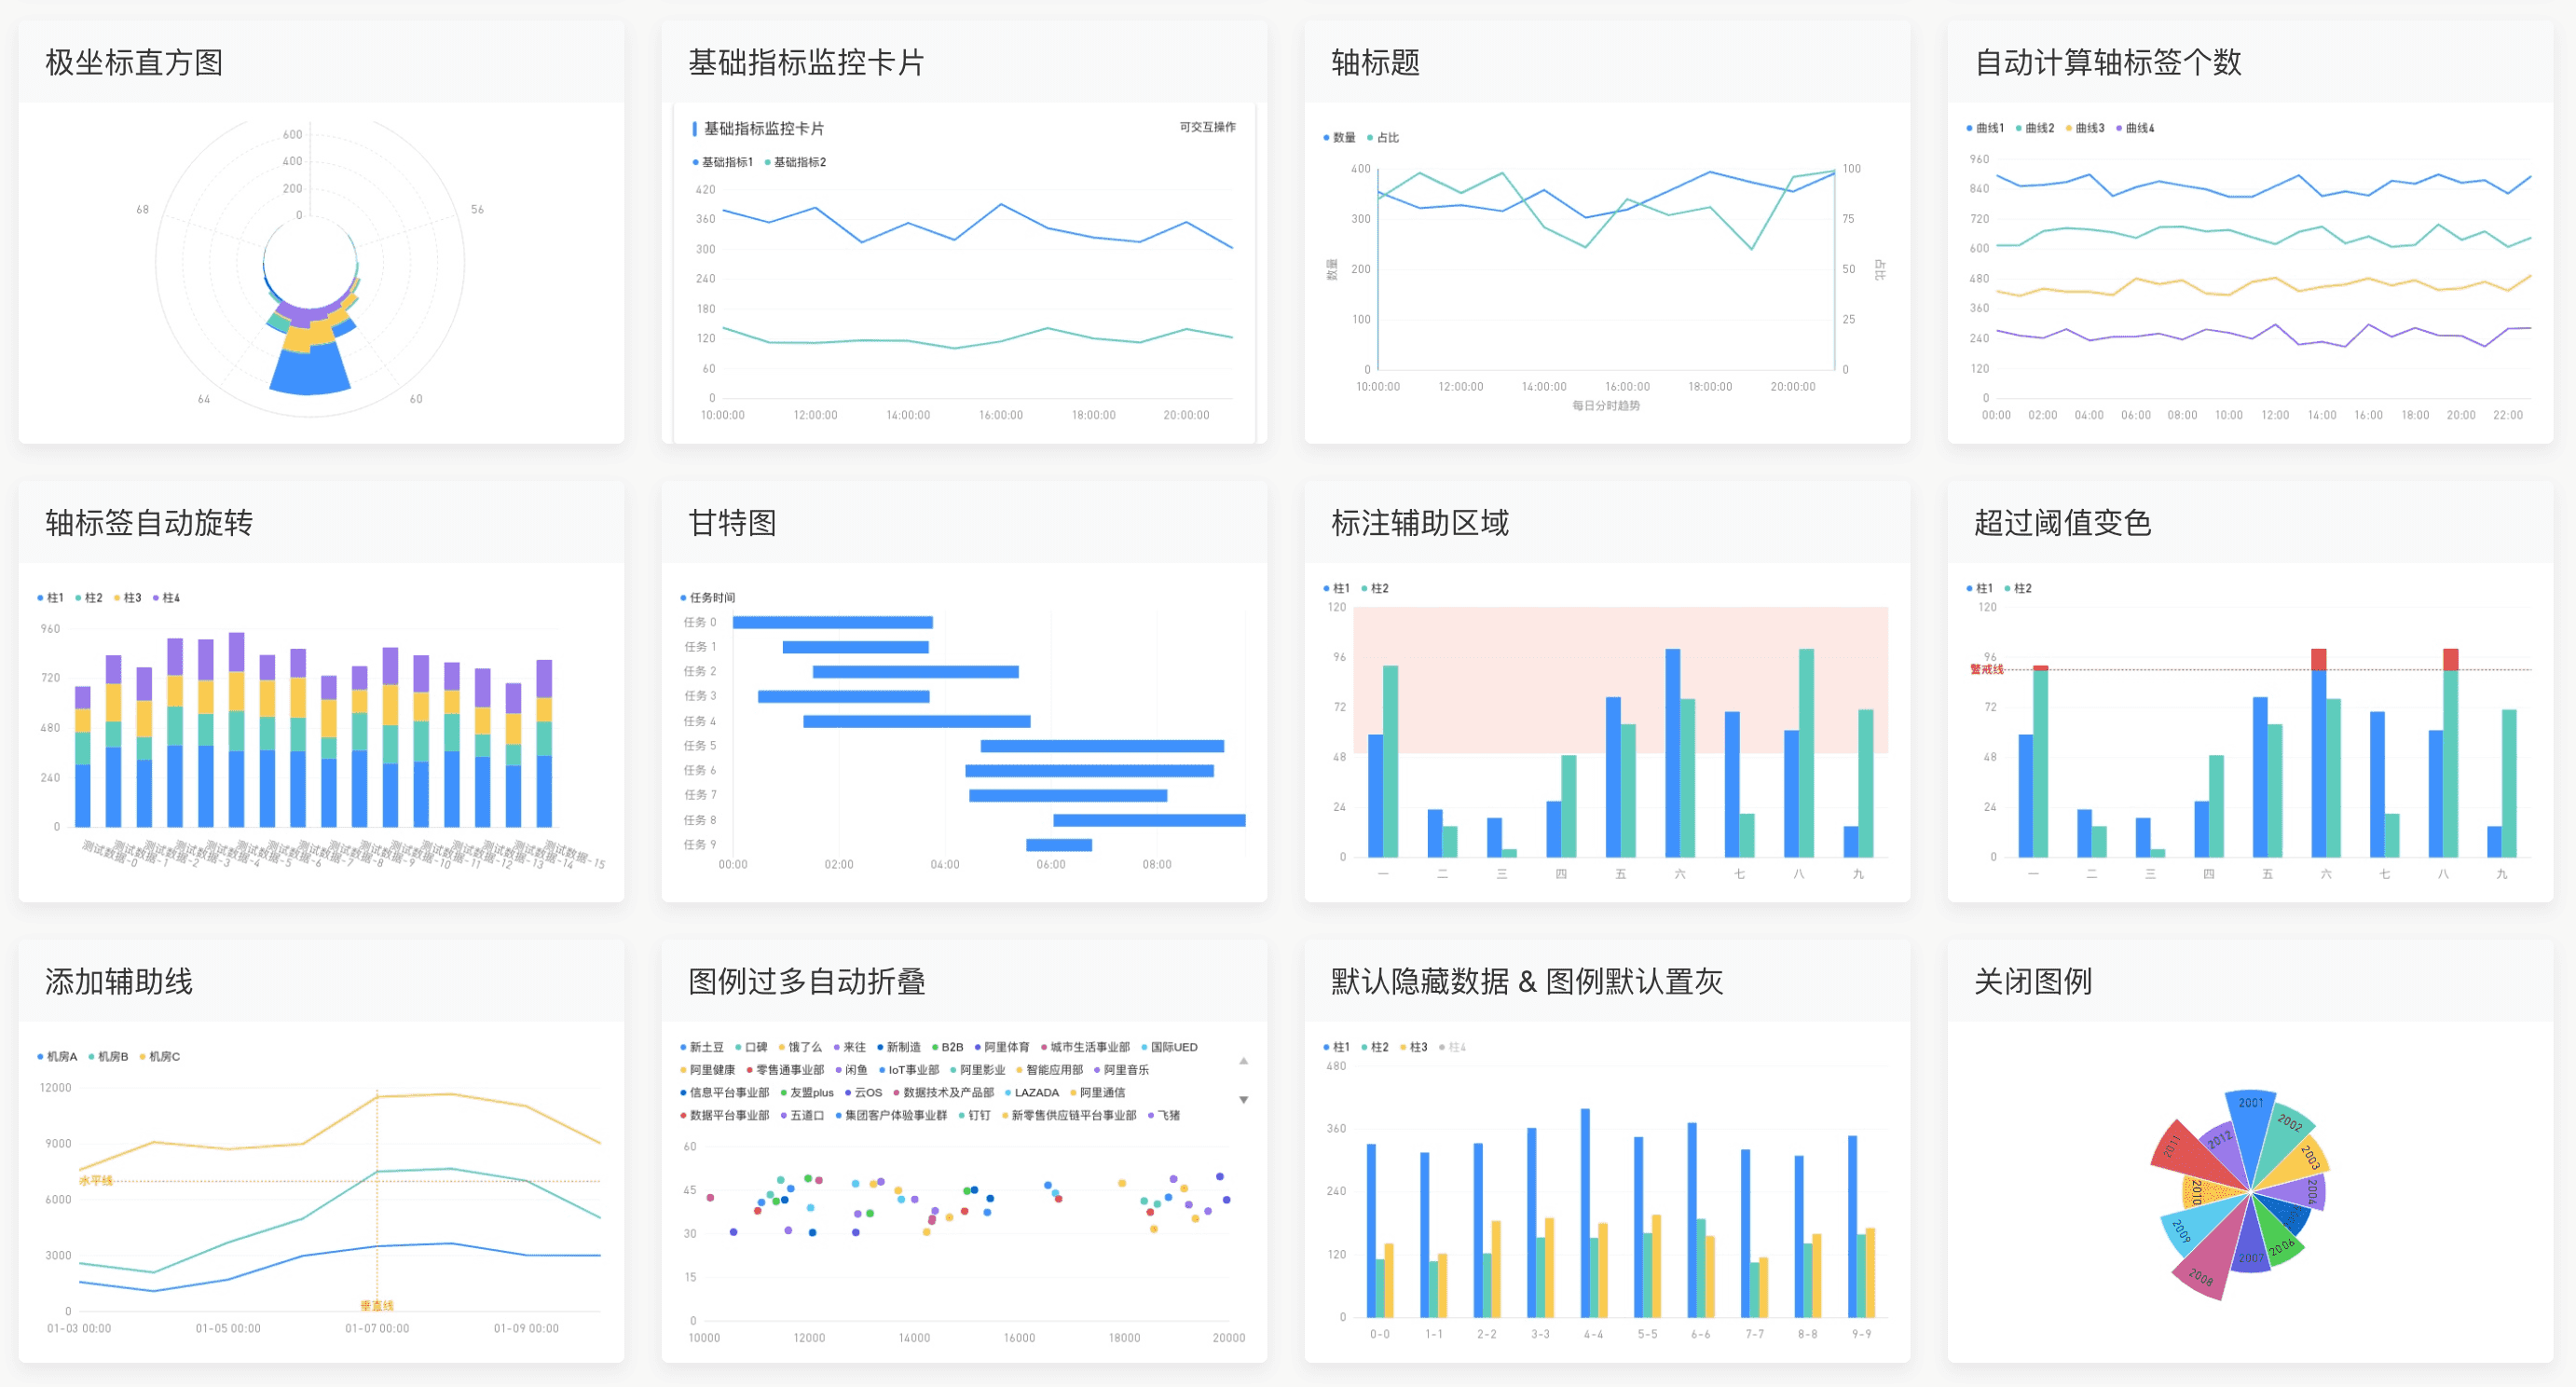
面向中后台的开箱即用图表库,让前端图表更简单。
-
简单上手,开箱即用。
-
React ES6 语法。
-
配置化图表,无需学习 G2 复杂的语法和数据映射。
-
一键切换主题。
-
全面拥抱 TypeScript
-
交互能力增强
-
平滑升级保障
-
大量优化迭代
$ npm install @alicloud/cloud-charts --save1、 引入图表需要的组件
2、 传入数据和配置项
import { Wcontainer, Wbar } from '@alicloud/cloud-charts';

// 准备一份数据列
const data = [
  {
    "name":"柱1",
    "data":[["一",59],["二",23],["三",19],["四",27],["五",77],["六",100],["七",70],["八",61],["九",15]]
  },
  {
    "name":"柱2",
    "data":[["一",92],["二",15],["三",4],["四",49],["五",64],["六",76],["七",21],["八",100],["九",71]]
  }
];

// 图表配置项
const options = {
  legend:{
    align: 'right'
  }
};

// 轻松绘制
function Demo() {
  return (
    <Wcontainer className="demos">
      <Wbar height="400" config={options} data={data} />
    </Wcontainer>
  );
}
一张柱状图就绘制成功了。
如果您在使用的过程中碰到问题,可以先通过 Issues 看看有没有类似的 bug 或者建议。
如需提交代码,请遵从我们的 贡献指南 。

