![]()
fgsea is an R-package for fast preranked gene set enrichment analysis (GSEA). This package allows to quickly and accurately calculate arbitrarily low GSEA P-values for a collection of gene sets. P-value estimation is based on an adaptive multi-level split Monte-Carlo scheme.
See the preprint for algorithmic details.
Full vignette can be found here: http://bioconductor.org/packages/devel/bioc/vignettes/fgsea/inst/doc/fgsea-tutorial.html
fgsea is a part of R/Bioconductor and is availble on Linux, macOS and Windows platforms. For the installation instructions and more details please refer to https://bioconductor.org/packages/release/bioc/html/fgsea.html
The latest version of fgsea can be installed from GitHub using devtools package, which can take up to a few minutes to install all the dependencies:
library(devtools)
install_github("ctlab/fgsea")
Loading libraries
library(data.table)
library(fgsea)
library(ggplot2)
Loading example pathways and gene-level statistics:
data(examplePathways)
data(exampleRanks)
Running fgsea (should take about 10 seconds):
fgseaRes <- fgsea(pathways = examplePathways,
                  stats    = exampleRanks,
                  minSize  = 15,
                  maxSize  = 500)
The head of resulting table sorted by p-value:
pathway                                 pval   padj   log2err  ES      NES     size
5990979_Cell_Cycle,_Mitotic             1e-10  4e-09  NA       0.5595  2.7437  317
5990980_Cell_Cycle                      1e-10  4e-09  NA       0.5388  2.6876  369
5990981_DNA_Replication                 1e-10  4e-09  NA       0.6440  2.6390  82
5990987_Synthesis_of_DNA                1e-10  4e-09  NA       0.6479  2.6290  78
5990988_S_Phase                         1e-10  4e-09  NA       0.6013  2.5069  98
5990990_G1_S_Transition                 1e-10  4e-09  NA       0.6233  2.5625  84
5990991_Mitotic_G1-G1_S_phases          1e-10  4e-09  NA       0.6285  2.6256  101
5991209_RHO_GTPase_Effectors            1e-10  4e-09  NA       0.5249  2.3712  157
5991454_M_Phase                         1e-10  4e-09  NA       0.5576  2.5491  173
5991502_Mitotic_Metaphase_and_Anaphase  1e-10  4e-09  NA       0.6053  2.6331  123
As you can see fgsea has a default lower bound eps=1e-10 for estimating P-values. If you need to estimate P-value more accurately, you can set the eps argument to zero in the fgsea function.
fgseaRes <- fgsea(pathways = examplePathways,
                  stats    = exampleRanks,
                  eps      = 0.0,
                  minSize  = 15,
                  maxSize  = 500)

head(fgseaRes[order(pval), ])
pathway                                          pval      padj      log2err  ES      NES     size
5990979_Cell_Cycle,_Mitotic                      4.44e-26  1.70e-23  1.3267   0.5595  2.7414  317
5990980_Cell_Cycle                               5.80e-26  1.70e-23  1.3189   0.5388  2.6747  369
5991851_Mitotic_Prometaphase                     8.50e-19  1.66e-16  1.1239   0.7253  2.9674  82
5992217_Resolution_of_Sister_Chromatid_Cohesion  1.50e-17  2.19e-15  1.0769   0.7348  2.9482  74
5991454_M_Phase                                  1.10e-14  1.29e-12  0.9865   0.5576  2.5436  173
5991599_Separation_of_Sister_Chromatids          3.01e-14  2.94e-12  0.9653   0.6165  2.6630  116
One can make an enrichment plot for a pathway:
plotEnrichment(examplePathways[["5991130_Programmed_Cell_Death"]],
               exampleRanks) + labs(title="Programmed Cell Death")

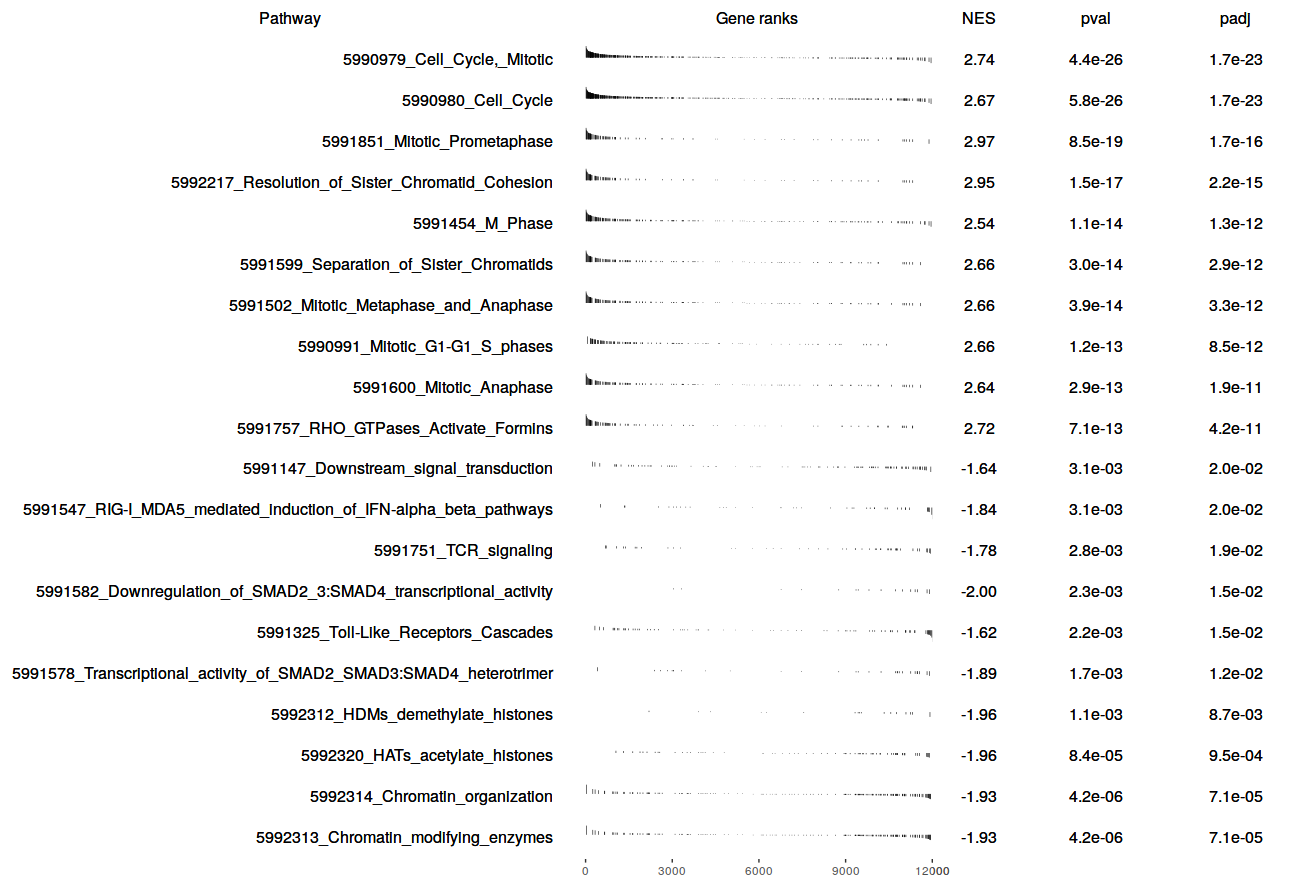
Or make a table plot for a bunch of selected pathways:
topPathwaysUp <- fgseaRes[ES > 0][head(order(pval), n=10), pathway]
topPathwaysDown <- fgseaRes[ES < 0][head(order(pval), n=10), pathway]
topPathways <- c(topPathwaysUp, rev(topPathwaysDown))
plotGseaTable(examplePathways[topPathways], exampleRanks, fgseaRes,
              gseaParam=0.5)