-
Notifications
You must be signed in to change notification settings - Fork 8
Scripts
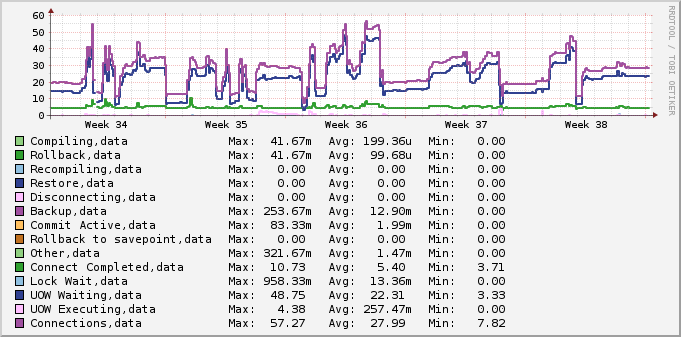
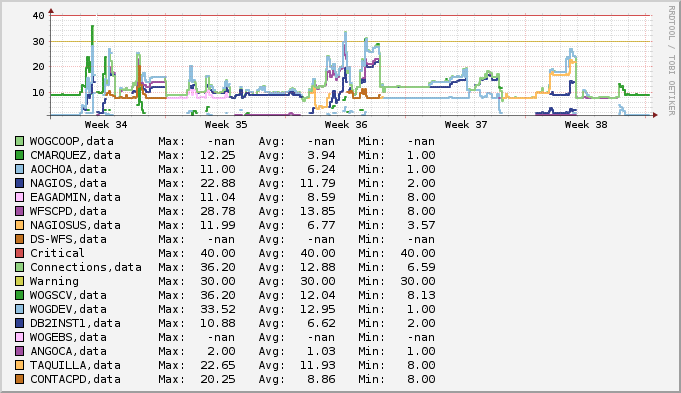
This script checks the quantity of established connections on the database. The quantity can be filtered by a given criterion, and inverted if wanted.
The connection state is based on the list application output. However, it is unknown how all states are expressed. For this reason, unknown states are sent to a file in /tmp directory in order to catch the text. Please send us the content of that file in order to improve this script. Currently, those unknown states are listed as 'other'.
The user that executes this script should have an authority at instance level (http://www-01.ibm.com/support/knowledgecenter/SSEPGG_10.5.0/com.ibm.db2.luw.admin.cmd.doc/doc/r0001958.html?lang=en):
- SYSADM
- SYSCTRL
- SYSMAINT
- SYSMON
There are two ways to call this script:
-> Group by status
./check_connection_qty -i /home/db2inst1/ -d sample -s
-> Group by user
./check_connection_qty -i /home/db2inst1/ -d sample
-> Group by status
OK. Normal quantity of connections (6).|'Connections'=6;10;15
|'Connect_Completed'=6
'UOW_Executing'=0
'UOW_Waiting'=0
'Lock_Wait'=0
'Commit_Active'=0
'Rollback'=0
'Rollback_to_savepoint'=0
'Compiling'=0
'Disconnecting'=0
'Backup'=0
'Restore'=0
'Recompiling'=0
'Other'=0
-> Group by user
OK. Normal quantity of connections (6).|'Connections'=6;10;15
DB2INST1 has 6,|'User_DB2INST1'=6
- This script is ready to use with Check_MK. Option
-K. The output is different. - If the script does not work, or the output is not correct, try to run it with the
-vvvoption, and then check the messages. - This script does not take into account subagents, just quantity of connections.
This script checks the connectivity to a database.
It requires the connection authority to the database.
This is the way to call the script:
./check_database_connection -i /home/db2inst1/ -d sample
The output shows the status of the connection:
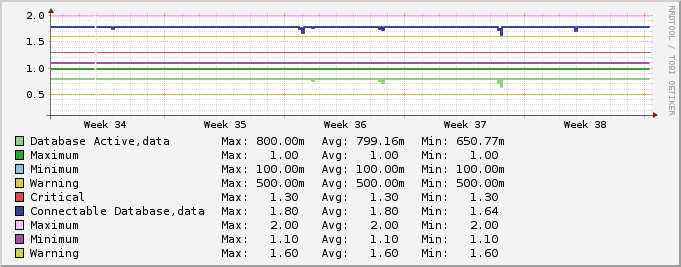
OK Connection to database sample. The database is active. |'Connectable_Database'=0.9;0.6;0.3
The database is active. |'Database_Active'=0.8;0.5
The values 0.9 and 0.8 are indicative, there are just to draw a line in the graph.
The graph show some perturbations in the blue line. It means that there were unavailability during that time.
- This script is ready to use with Check_MK. Option
-K. The output is different.
This script checks the database size. Retrieves a critical alarm when the size is bigger than the given size in critical, or retrieves a warning alarm when the size percentage is bigger than the provided, comparing with the allocated size.
Be careful when using with a standby database in an HADR environment. The values should be updated in the primary database. The standby should only retrieve these values. If the primary database does not update the values, the standby will generate errors.
The user that executes this script needs some special permission in the tables associated with storage management.
For example, if the user that executes the script is nagios, you should execute this.
db2 grant execute on procedure sysproc.GET_DBSIZE_INFO to user nagios
db2 grant execute on package NULLID.SYSSH200 to user nagios
db2 grant select,update on table SYSTOOLS.STMG_DBSIZE_INFO to user nagios
You can also be executing the commands from root, in the case you are using Check_MK.
The user should be in the group of SYSMON authority.
It could also possible to require a rebind in some packages. For that, you can do this:
db2rbind sample -l /tmp/log.bnd
This is the way to call the script:
./check_database_size -i /home/db2inst1/ -d sample
The output shows the status of the database:
OK. Size is 17630625792B allocated in 38769844224B|'Database_size'=17630625792B
|'Database_allocation'=38769844224B
- This script never generates an alert. It is just for informative purposes, and have an evolution graph of the database size in Nagios. If something like Cacty is used, this kind of graph could be not used.
- This script is ready to use with Check_MK. Option
-K. The output is different.
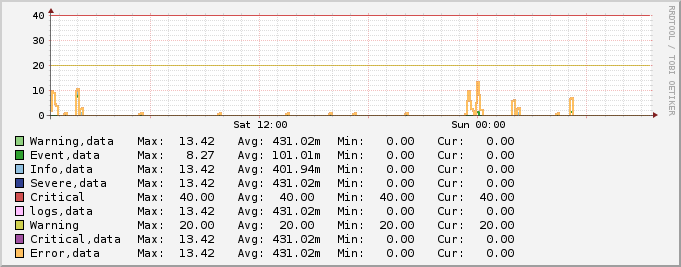
Check the quantity of messages written in the db2diag.log file. It allows to detect an abnormal behaviour in the instance, because most of the time, when an recurrent error happens in the database/instance, it is described in the diagnostic file.
Access to the db2diag.log file.
This is the way to call the script:
./check_db2diag -i /home/db2inst1/
The output shows the quantity of messages in the db2diag.log file:
OK, quantity is normal (0) since 2014-09-21-09.38.08.|'logs'=0;20;40
Messages by levels. Severe: 0, Critical: 0, Error: 0, Warning: 0, Info: 0, Event: 0|'Severe'=0
'Critical'=0
'Error'=0
'Warning'=0
'Info'=0
'Event'=0
- The quantity of messages (blank lines) and lines can be retrieved. This could give you an idea of how big is the file.
- If you get a message like this
File permissions are wrong '/tmp/last_date_check_db2diag__home_db2inst1_'in the output, then you should go to the /tmp directory and delete the file, or change its permissions (write to all). - This script is ready to use with Check_MK. Option
-K. The output is different.
Checks the HADR status by looking if both databases are connected. This script shows the difference in replication between the two machines.
At least SYSMON authority.
This is the way to call the script:
./check_hadr_status -i /home/db2inst1/ -d sample
The output shows the status of the HADR and its synchronization:
TODO output
If HADR is not configured:
Database is not in HADR|
|
TODO image
- This script is ready to use with Check_MK. Option
-K. The output is different.
Checks the memory usage by an instance. It does not take into account the bufferpools, or other memory dumps, it just takes the result of the query. The query is executed against the first connectable database of an instance.
The user used to execute the script should have a special privileges in at least one of the database of the instance analyzed; the privilege are:
db2 grant execute on package NULLID.SQLC2H21 to user nagios
db2 grant execute on specific function SYSPROC.ADMIN_GET_DBP_MEM_USAGE to user nagios
db2 grant execute on specific function SYSPROC.ADMIN_GET_DBP_MEM_USAGE_AP to user nagios
db2 grant usage on workload SYSDEFAULTUSERWORKLOAD to user nagios
This is the way to call the script:
./check_instance_memory -i /home/db2inst1/
The output shows the used memory:
OK, memory usage is automatically.| 'Current_memory_at_node_0'=999MB
At node 0 the max usage memory is 744MB and the current usage memory 999MB.| 'Max_memory_at_node_0'=744MB
- This script is ready to use with Check_MK. Option
-K. The output is different.
This script queries the status of the instance by retrieving the port number or service name from the configuration, and then querying netstat to check if there is an associated service with that port.
It is necessary to execute this script with a user with at least SYSMON authority, in order to retrieve all the necessary information. If not, the script will produce a critical alert indicating that the PID of the instance cannot be retrieved.
This is the way to call the script:
./check_instance_up -i /home/db2inst1/
The output shows the quantity of messages in the db2diag.log file:
Instance at /home/db2inst1/ is up (PID 21560).|'Started_Instance'=2;;0.4
There are 1 active databases|'Active_Databases'=1
As we can see in the graph, there are some periods where the instance was down.
- This script is ready to use with Check_MK. Option
-K. The output is different.
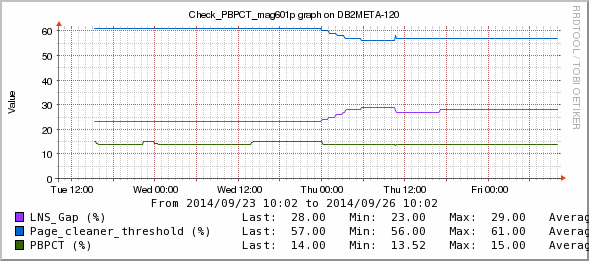
Checks the performance of the IO cleaners (Page cleaners) by calculating the percentage between Sync and Async writes, and the percentage between the page cleaner triggers (LSN Gap cleaner trigger, dirty page steal clean trigger and Dirty page threshold cleaner.
These formulas were taken from different sites:
- http://books.google.fr/books?id=KdBLn-LQ0n4C&pg=PA110&lpg=PA110&dq=pbpct+percentage+of+bad+page+cleaner+trigger&source=bl&ots=WZNE0msIaO&sig=6Kk4VWXK0Yw1EusO82U8w4FhTGs&hl=en&sa=X&ei=F-cbVMbuLMXnOf_ygbAO&ved=0CCMQ6AEwAA#v=onepage&q=pbpct%20percentage%20of%20bad%20page%20cleaner%20trigger&f=false
- http://www.ebenner.com/db2dba_blog/
- http://www.dbisoftware.com/blog/db2_performance.php?id=117
There are two ways to call this scripts:
- Percentage of Bad Page Clean Trigger
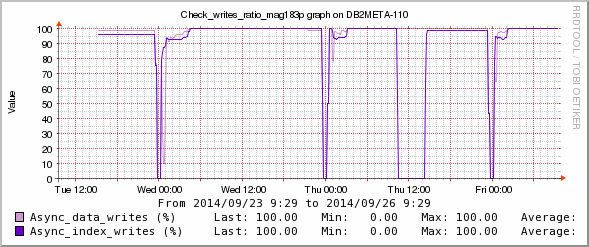
- Ratio between Async writes and total writes.
At least SYSMON authority to run db2pd.
-> Calculate PBPCT:
./check_io_cleaners -i /home/db2inst1/ -d sample
-> Shows the ratio
./check_io_cleaners -i /home/db2inst1/ -d sample -a -c 90 -w 95
It is important to define the thresholds. Otherwise, it will automatically throws an error.
-> PBPCT output:
Percentage of Bad Page cleaner trigger is OK|'PBPCT'=0%;20;40;0;100
|'LNS_Gap'=0%
'Page_cleaner_threshold'=0%
-> Ratio of writes
Quantity of asynchronous writes is bad and it is impacting the performance|'Async_data_writes'=100%;95;90;0;100 'Async_index_writes'=0%;95;90;0;100
|
- This script is ready to use with Check_MK. Option
-K. The output is different.
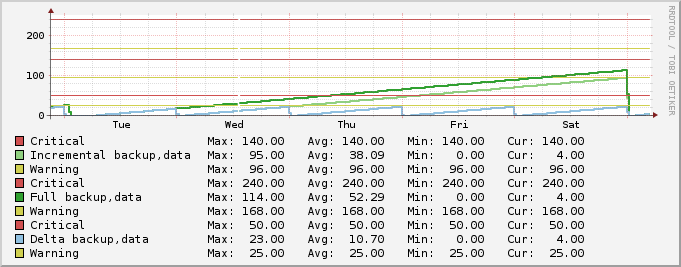
This scripts checks the elderly of the last backup. It throws alerts if the last backups are too old.
The execute could take a long time, so it is recommended to configure this script adequately.
Some privilege to access sysibmadm.db_history.
The way to call this script.
./check_last_backup -i /home/db2inst1/ -d sample -c 240:140:50 -w 168:96:25
The thresholds are defined as triplets, for the full, incremental and delta backup.
This generates the following output:
OK Full. OK Incremental. OK Delta.|'Full_backup'=14;168;240
|
- This script is ready to use with Check_MK. Option
-K. The output is different.
This script helps to create a graph of how many transaction logs have been used in the day, and it only retrieves performance data by returning always OK if the value could be retrieved. It allows to identify the period of the day when transaction consumes the most of transaction logs.
At least SYSMON authority in order to execute db2pd.
This is the way to call this script:
./check_log_consumption -i /home/db2inst1/ -d sample
The generated output is:
Archive logs counted|'Size_archive_logs'=0
|
- This script is ready to use with Check_MK. Option
-K. The output is different.
This script checks the log usage to prevent log full conditions when there are long transactions.
This script needs:
- Access to the directory of the logs.
- Authorization on the SYSIBMADM.LOG_UTILIZATION administrative view.
There are two ways to call this script:
-> To calculate the quantity of bytes used:
./check_log_usage -i /home/db2inst1/ -d sample
-> To calculate the quantity of files used as primary logs:
./check_log_usage -i /home/db2inst1/ -d sample -f
Depending on the given parameters, the output is:
-> Quantity of bytes
The transaction log utilization is OK.|'Log_qty_used'=0;200000;330000;0;460000
The top for the moment has been 0.|'Max_used'=0
-> Quantity of files
The transaction log utilization is OK.|'Log_files_used'=99;101;150;;230
|
- This script is ready to use with Check_MK. Option
-K. The output is different. - The option
-fallows to change the behaviour of the calculation.
Checks the quantity of open files by a given instance.
This file execute the command lsof as root with the sudo command. In this case you need to give the necessary right to execute this command as root. Normally, you can do that just by adding a line in the sudoers file. The best is to edit this file with the command: 'visudo'
The way to call this script.
./check_open_files -i /home/db2inst1/
This generates the following output:
OK. List of open files for instance db2inst1 is 361|'Open_files'=361;;;;1024
|'Hard_limit'=4096
- This script is ready to use with Check_MK. Option
-K. The output is different.
Checks the utilities that are currently running in the instance. Throws a warning if a restore or backup is being performed.
This script needs to access tha table where tablespaces are described.
db2 grant select on table SYSIBMADM.TBSP_UTILIZATION to user nagios
The way to call this script.
./check_tablespace_size -i /home/db2inst1/ -d wfscpd --id 2
This generates the following output:
OK tablespace size (17% - Auto resize).|Tablespace=5MB
Tablespace TS16K has allocated 32 MB and its watermark is at 7|Allocated=32MB
Watermark=7MB
- This script is ready to use with Check_MK. Option
-K. The output is different. - If you do not use the
--idoption you can indicate the name of the tablespace, however it should be in uppercase (the same case as in the db2 catalog).
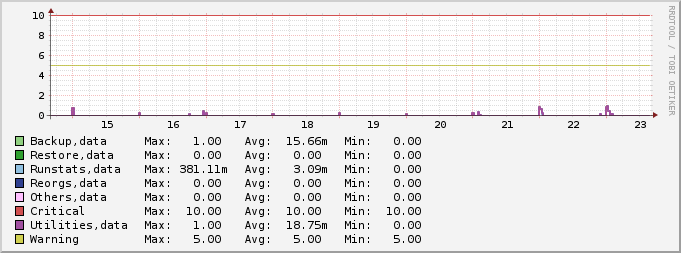
Checks the utilities that are currently running in the instance. Throws a warning if a restore or backup is being performed.
At least SYSMON authority in order to execute list utilities.
The way to call this script.
./check_utilities -i /home/db2inst1/
This generates the following output:
Quantity of utilities is normal: 0.|Utilities=0;5;10
|Restore=0 Backup=0 Runstats=0 Reorgs=0 Others=0
- This script is ready to use with Check_MK. Option
-K. The output is different.
