-
Notifications
You must be signed in to change notification settings - Fork 12
Curve Tracing
Previously, we demonstrated how to measure component networks for phase and frequency response - AC effects. Today, we'll demonstrate how to use the Tsunami for curve tracing, a DC effect.
While frequency response is about determining how something behaves at different frequencies, curve tracing is about determining how something responds at different voltages. To do this, we sweep the output voltage of the Tsunami through a range, and at each point, measure the voltage across the device we're testing.
In these examples, we're using an oscilloscope for simplicity. We simply used the Tsunami's provided frequency generator sketch, told it to generate 50Hz, and hooked it and the test device up to the oscilloscope. All of these measurements could have been made with the Tsunami's input circuitry, too, if you don't have an oscilloscope; look for a future howto describing the code required to do this.
First off, we'll measure the forward drop of a diode - specifically, the B140, which I happened to have in my component box. Looking at the graphs in its datasheets, it should have a forward voltage somewhere around 0.25-0.3V at room temperature with minimal current.
Here's the circuit we'll use to test it:
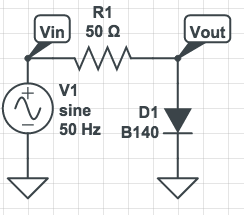
R1 is a 50 ohm resistor that's internal to the Tsunami, while V1 represents the Tsunami set up to generate a 50Hz sine wave. D1 is the diode we're testing. We'll hook up oscilloscope probes to Vin, which will show the voltage the Tsunami's producing, and Vout, which shows the voltage across the diode. Here's what we get as a result:
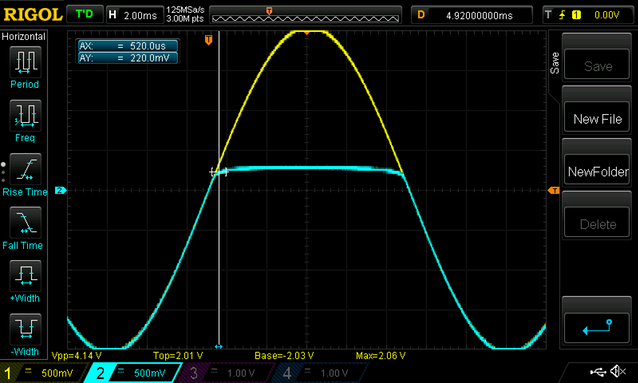
Vin is in yellow, and Vout in white. You can see that when the voltage is negative, Vout tracks Vin, because no current is flowing through the diode to ground. As soon as Vin goes over the diode's forward voltage, however, the diode turns on, and the voltage flattens out. We've used a cursor here to demonstrate that the voltage at which this first happens is about 0.22V - pretty much what the datasheet predicted.
A perfect diode would have 0 resistance above its forward voltage, so no matter how much current we pushed through R1, the voltage would remain the same. The diode we're testing here is a high power one, so that's a pretty good assumption, but even it isn't perfect. Take a look at this closeup of the voltage across the diode:
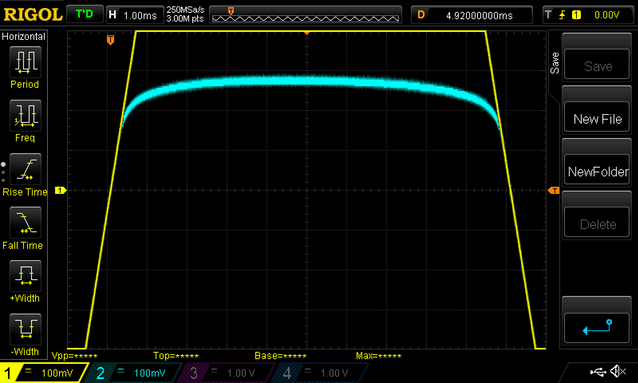
It's not much, but you can see that as the voltage we're applying increases, increasing the current through the diode, the voltage across it increases a little too. The diode actually starts turning on as low as 0.15V, and by the time we're putting 4mA through it, that's increased to about 0.28V. If we were using this diode for its intended purpose, as a high power rectifier, that would increase even further, as you can see if you look at the diode's characteristics in the datasheet.
Measuring a diode was educational, but we saw pretty much exactly what we expected to see. Let's take a look at a FET, instead, the 2n7002. This is a 'jellybean' N-channel MOSFET, often used for low power switching. If you're not familiar with MOSFETs, the basic outline is that they're voltage-controlled switches: when there's enough voltage on their gate, they conduct power from their drain to their source.
One of the main characteristics of a MOSFET is its gate threshold voltage - the voltage at which it turns on. The 2n7002's datasheet lists that as 2V typical. An ideal FET would turn on the moment it hits that voltage, like a true switch, but real life FETs are far from ideal, and the gate threshold voltage goes up as the amount of current through the FET increases. Let's see how that plays out with our test FET.
Our test circuit this time is a little more complex than last time:
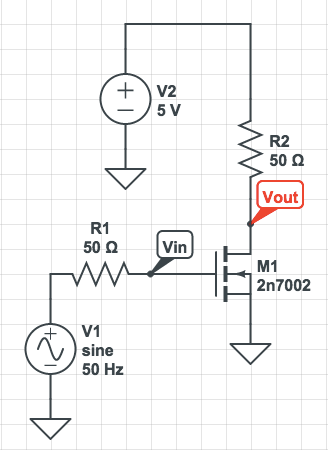
V1 and R1 are the Tsunami and its internal 50 ohm resistor, just like last time. M1 is our FET. We've hooked its gate up to the Tsunami, its source to ground, and its drain, through a 50 ohm resistor, to our 5V bench supply.
On the oscilloscope, we'll measure the voltage generated by the Tsunami, Vin, and the voltage across the FET, Vout. We'd expect Vout to stay at 5V until Vin gets high enough to turn the FET on - at which point the voltage will drop as the FET conducts current to ground. Let's see.
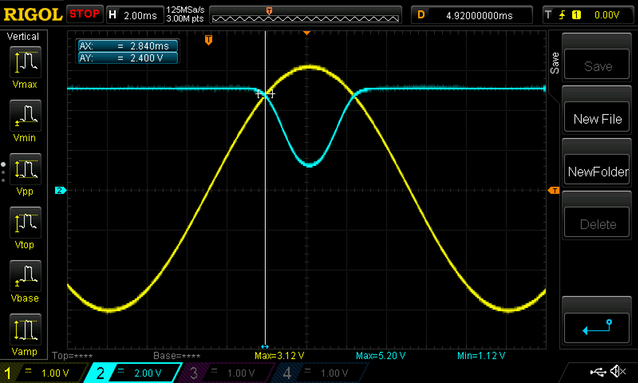
Once again, yellow is the output of the Tsunami (Vin), and white is the voltage on Vout. Just as we expected, the voltage drops once the gate voltage rises high enough, but as you can see, this is far from an ideal FET. It starts switching on at 2.4V, pretty close to what the datasheet predicts, but at that voltage it only conducts a very little current. As the voltage on the gate increases, so too does the amount of current it will conduct, but once we reach our peak voltage of 3.12V, we're still seeing 1.12V across the FET. A little math tells us that with (5V - 1.12V) across our 50 ohm input resistor, that's about 77 milliamps through the resistor and FET.
So, there you have it. An example of how you can use the Tsunami for common curve tracing applications, and an illustration of why you shouldn't try and use the 2n7002 for logic level switching - use something with a lower gate voltage like the BSS138 instead!