-
Notifications
You must be signed in to change notification settings - Fork 12
Measuring Component Networks
In a previous tutorial, we used the Tsunami to produce a basic frequency response plot for a headphone amplifier. Today, we'll take a look at a more sophisticated version, measuring phase and frequency response of electrical components.
For this, we'll use an improved sketch. Once again, note that we're using a very early version of the library; some of this may change by the time the Tsunami's in your hands!
It's also worth noting that this is very much a "how the sausage is made" type tutorial; we'll be providing a sketch that automates much of this as one of the examples in the Arduino library.
float factor = pow(10, 1/50.0);

void setup() {
    Tsunami.begin();
    Tsunami.setAmplitude(3000);
    Tsunami.enablePhaseMeasurement();
}

void loop() {
    float frequency = 1000.0;
    while(!Serial.available());
    while(frequency < 4000000.0) {
        Tsunami.setFrequency(frequency);
        frequency *= factor;
        delay(1000);
        Serial.print(frequency);
        Serial.print(", ");
        Serial.print(Tsunami.measurePeakVoltage());
        Serial.print(" ");
        Serial.println(Tsunami.measurePhase());
    }
}
First, we define the rate at which we'll scan, as 50 measurements per decade. Then, we set up the Tsunami, enabling it, setting the output voltage to 3 volts peak-peak, and enabling phase measurement. This last one is a separate option because it involves enabling the square-wave output on the auxiliary port.
In the main loop, we wait for a keypress, then starting at 10 kilohertz and going up to 4 megahertz, we step through the frequency range. At each, we set the frequency, wait a while, then measure and output both the amplitude, and the phase of the return signal.
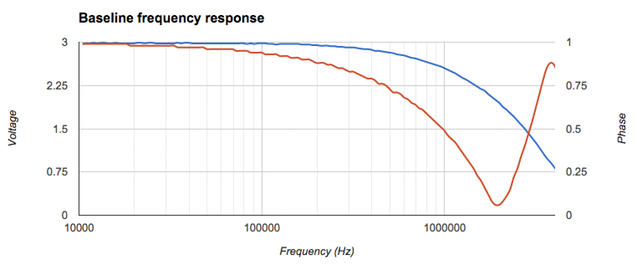
Before we can get useful measurements, we need a baseline. For that, we'll plug the Tsunami's output into its input, then measure and graph the result:

This shows us the amplitude and phase response for the entire Tsunami signal chain, both output and input. The blue line is voltage, charted using the axis on the left, while the red line is phase offset, charted using the axis on the right. As you can see, the Tsunami's amplitude response is fairly smooth, tapering off at higher frequencies - by 4MHz (twice its design maximum) we're down to 25% - this is due to the lowpass filters on both input and output. The phase difference also increases as the frequency goes up, due to delays in the signal processing chain.
Next, on to measuring something! The simplest thing we can measure is a single component; here we'll measure an unknown inductor, simply hooking it up across the Tsunami's input and output terminals with a couple of test clips. The Tsunami's built in 50 ohm output resistor forms one half of a voltage divider, and the inductor forms the other.
After hooking it up, we run our frequency sweep, and get this result:
https://raw.githubusercontent.com/arachnidlabs/tsunami-arduino/docs/network-measured-response.png
To get a useful result, though, we need to normalise it using the Tsunami's measured frequency response. We'll do that by dividing the amplitudes, and subtracting the phases, producing our final result:
https://raw.githubusercontent.com/arachnidlabs/tsunami-arduino/docs/network-response-computed.png
Presto! As you'd expect for an inductor, the voltage across it - and thus, its resistance - increases with frequency. We haven't made any attempt to normalise the values here, so we can't get an actual value for the inductor, but with a little number crunching we could easily compute the inductor's value, along with other values like its series resistance, parasitic properties, and so forth.
As you might expect, this extends easily to measuring more complex networks of components, passive filters, and so forth.