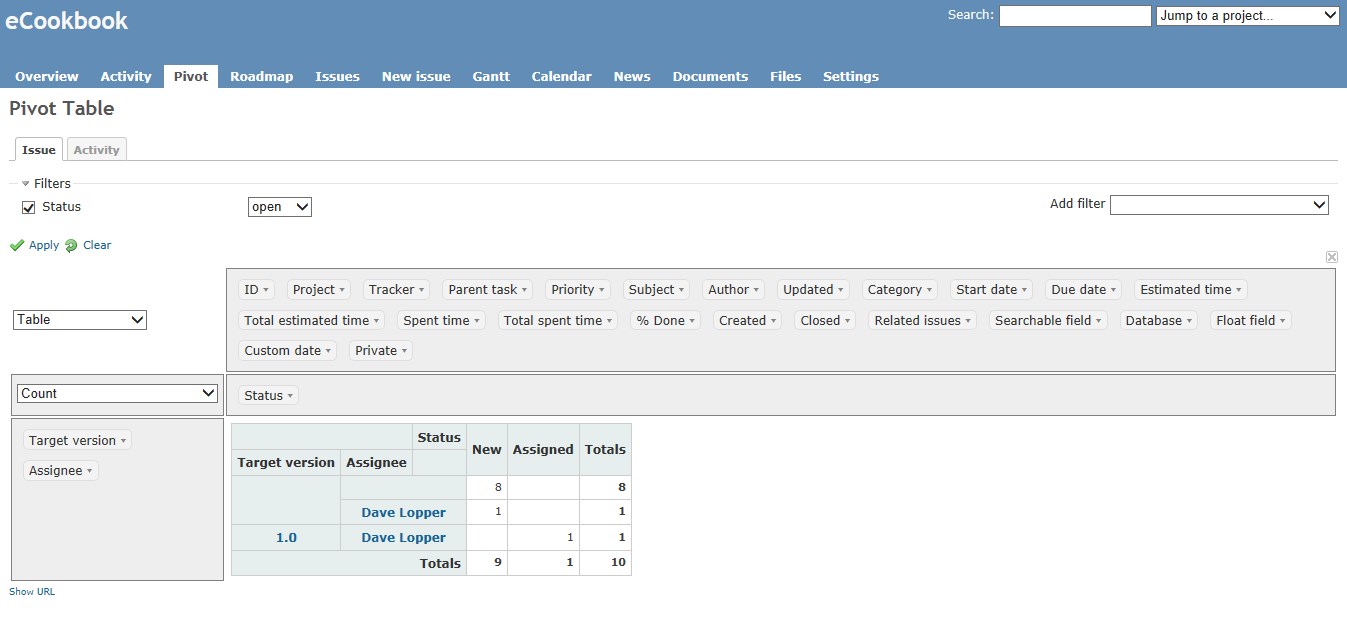
This Redmine plugin allows you to generate pivot table for issue analysis.
It uses PivotTable.js as a user interface.
With this plugin you can:
- Analyze issues and activities by pivot tables and graphs
- Drag and drop attributes to dynamiccaly change rows/columns configuration
- Save your configuration as queries
Requieres IE8 and above. PivotTable.js version included: May 20, 2016
-
Follow the standard Redmine plugin installation steps at: http://www.redmine.org/wiki/redmine/Plugins
git clone https://github.com/deecay/redmine_pivot_table.git -
Enable Pivot module for your project.
-
Allow permission to view pivottables from Administration -> Roles and permissions
-
Go to Pivot tab of your project.
No migration required.
Drag and drop attributes to dynamically create your own pivot table.
For more information on usage, visit PivotTable.js Home page.
You can save the pivot table configuration when you save a query from the Pivot page.

See en.yml for localizable text
For aggregator and renderer names, consult pivot.pt.js and send pull request to nicolaskruchten
- Add "edit pivot query".
- Some clean-ups of code and locale after recent changes.
Pivot Table, Graphs, Analysis, Redmine, Plugin
Support will only be given to the following versions or above:
- Redmine version 2.6.0.stable
- Ruby version ruby 2.1.5p273
- Rails version 3.2.19
This plugin is licensed under the MIT license.


