- License: GPL-3.0-or-later
❯ lsd --tree --sort extension
.
├── us_states # shape file
├── recordings # required for build output
├── tools
│ ├── optimizer_for_states.py
│ └── plot_color_gradients.py
├── Dockerfile
├── states_no_wa.csv
├── README.md
├── geospatial_map.py # mapped numbers animation
├── bar_chart.py # bar chart animation
├── test_setup.py
├── docker-entrypoint.sh
├── container_enter.sh # interactive shell
├── container_run.sh # run command for docker
├── requirements.txt
└── LICENSE.txt # gpl ftw
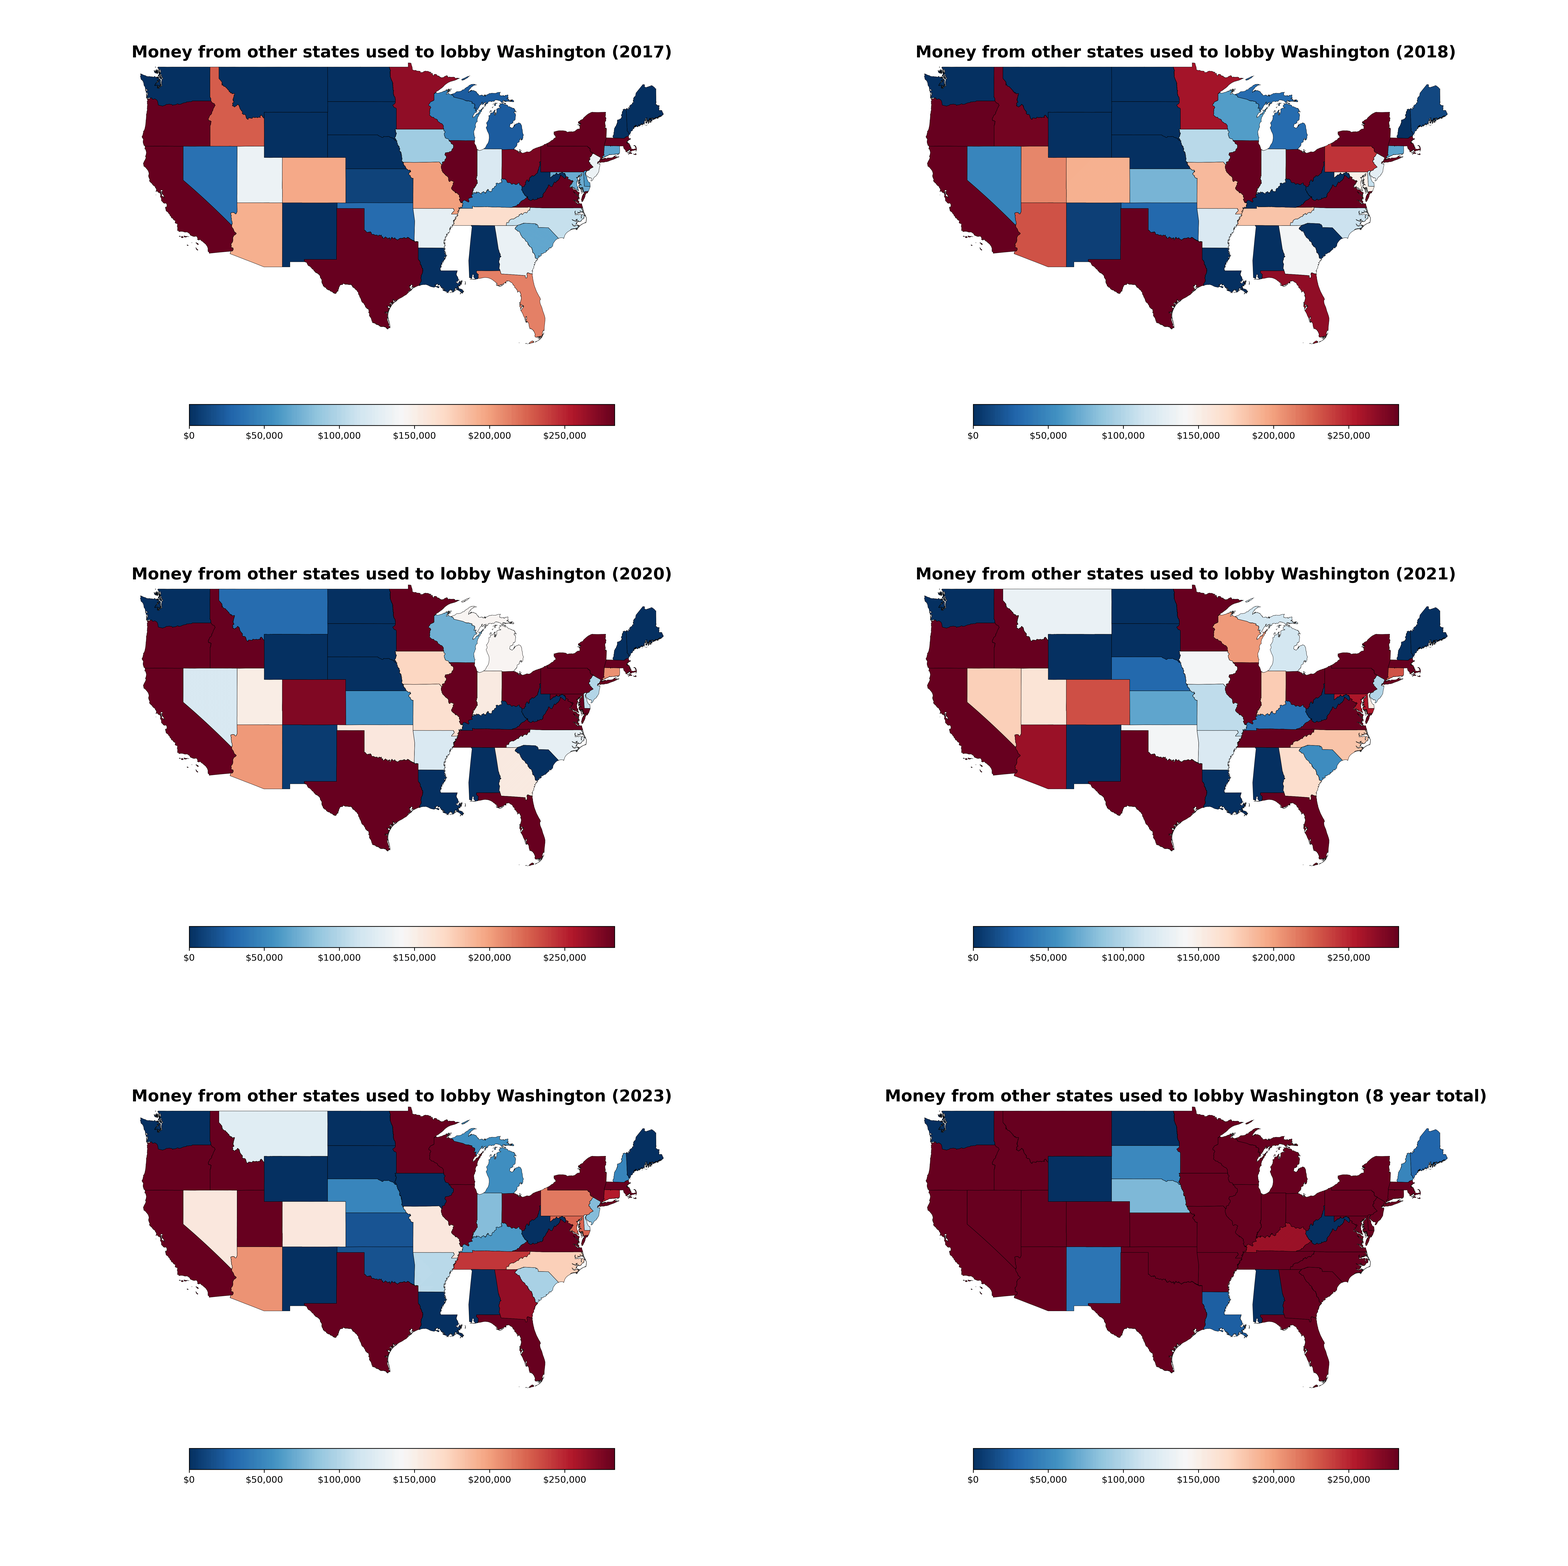
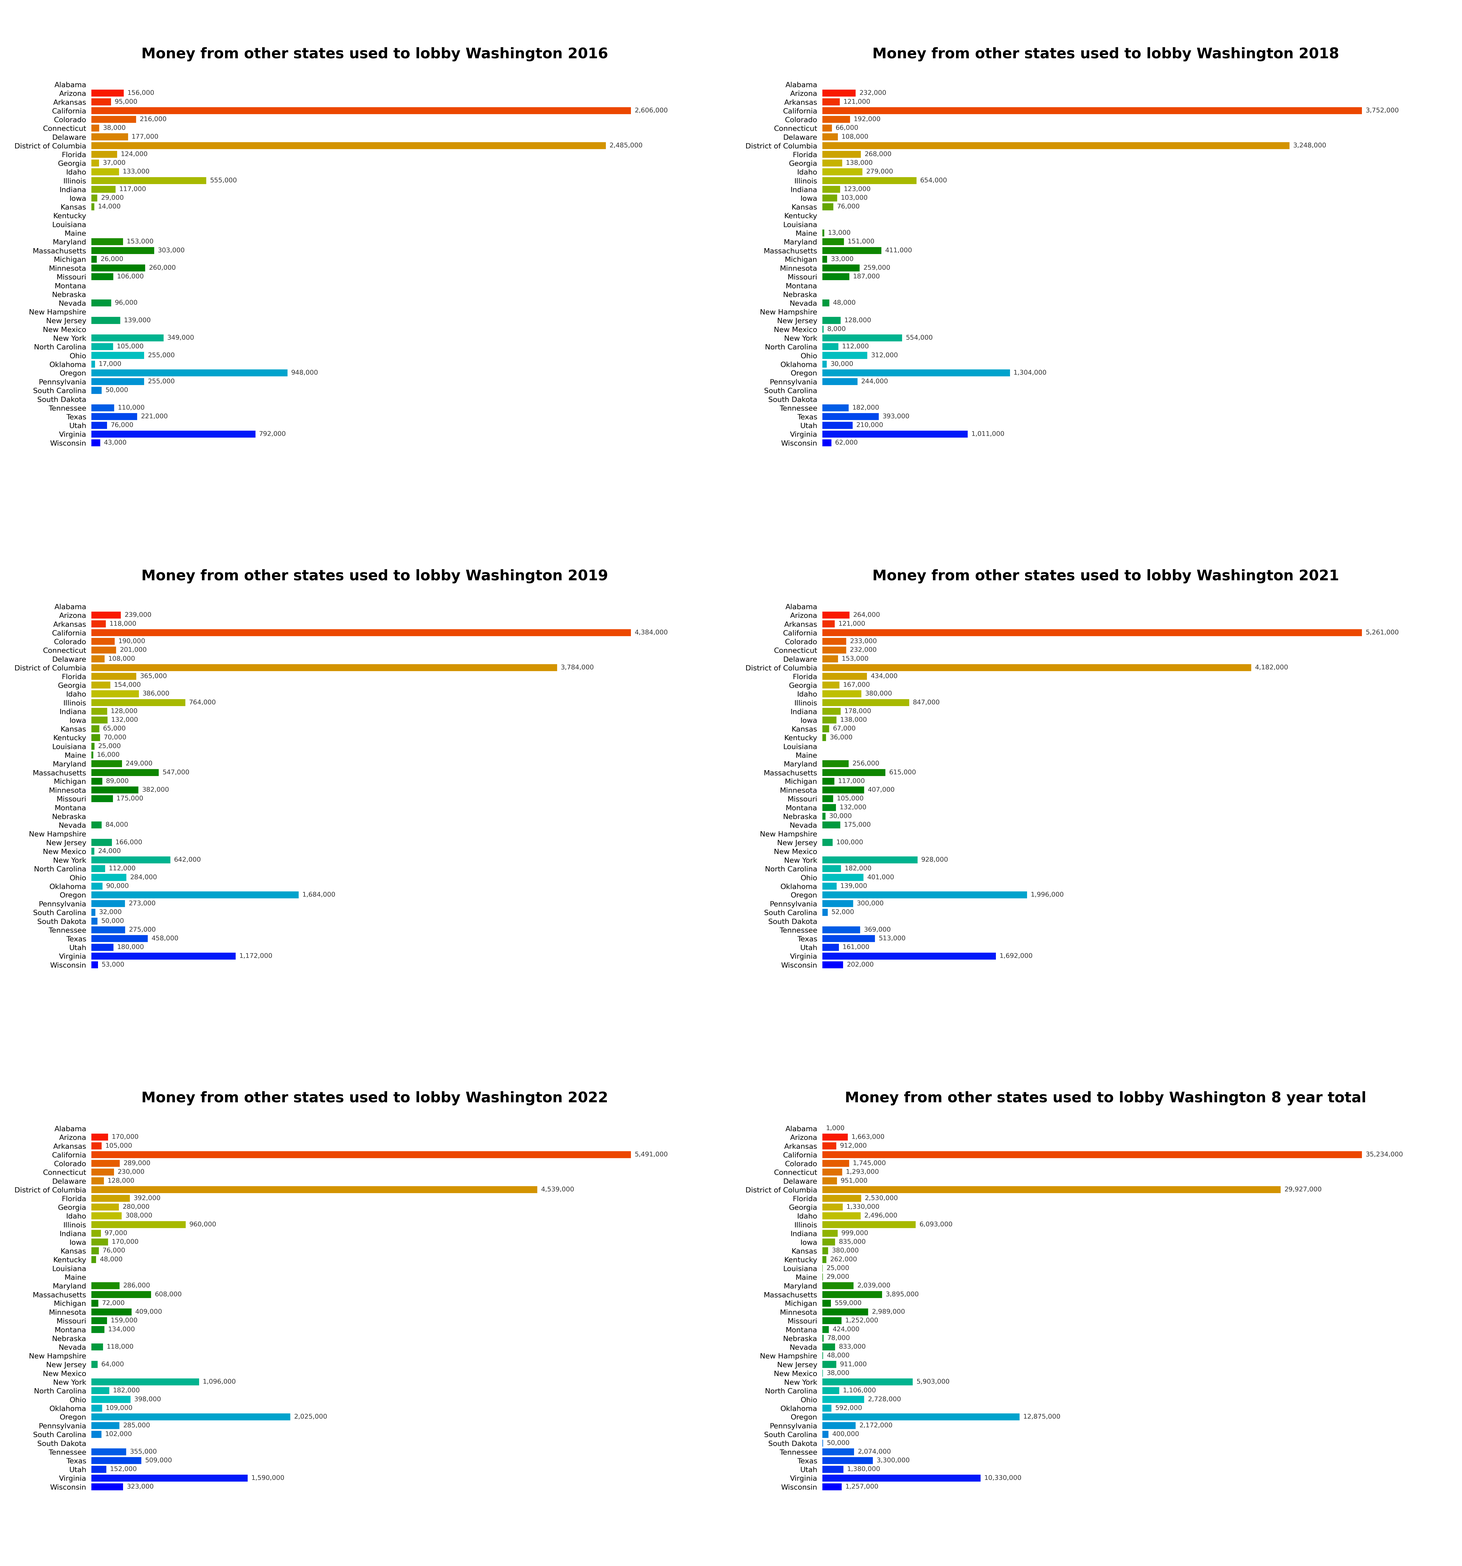
I was looking through data.wa.gov for a dataset to do a project with, and I saw that the PDC has information from lobbyist disclosures on who is funding their lobbying efforts. I thought that was really interesting, so I looked into it more, and one of the things that really struck me was from how much of the money is coming from outside of WA. The first name that really jumped out at me was Advanced Check Cashing in Virginia, since they were at the top when viewing alphabetically, but they were only one of hundreds of entities in other states that lobby us every year.
I plan to release more charts done with other information from this dataset. I have a blog site I have a couple more charts on at developer monkey / unixgreybeard.org which I will certainly be updating as soon as possible. Right now, these standalone project charts in this repo only show state origin granularity, but there are some different directions I've gone charting the data, with top lobbyists by aggregate spending, top political donors, and top ballot measure backers (or opposers). The other charts are in a jupyter notebook, and I will be creating a separate repo for it asap.
The easiest thing to do is run the chart recorders in a docker image, that way the dependencies are isolated from your system completely, and it returns the recordings in both .gif and .mp4 format in the $(pwd)/recordings folder.
OCI version is available at https://hub.docker.com/r/averyfreeman/wa-lobbbyist-dataset-animations - it requires a recordings folder for the output
sha256: e2263a66e1362e69867771a0dc789b98a78ed9048da1721b9befc25966e8aa52

# pull image and check against hash:
❯ docker pull averyfreeman/wa-lobbbyist-dataset-recordings:latest

# verify
❯ docker image inspect --format '{{.ID}}' averyfreeman/wa-lobbbyist-dataset-animations
sha256:e2263a66e1362e69867771a0dc789b98a78ed9048da1721b9befc25966e8aa52

# in your workdir (if not already present):
❯ mkdir recordings

# container_run.sh - for recordings only:
❯ docker run -v $(pwd)/recordings:/app/recordings -p 8000:8000 averyfreeman/wa-lobbbyist-dataset-recordings:latest

# container_enter.sh - to run interactively:
❯ docker run -v $(pwd)/recordings:/app/recordings -p 8000:8000 -it averyfreeman/wa-lobbyist-dataset-animations /bin/bash
Please update the data and the analysis to your liking, these files are definitely meant to be a guide for other people looking for ideas and tools to realize their own data visualization projects. You could create a devcontainer and isolate the project from your base system even while altering the source code, as well. If you want to build the container yourself,
- clone repo - dataset and shapefile are included
- run docker build .
If you want to create a non-containerized local build environment, I included a little test script to make sure you have the dependencies you need installed:
- clone repo - dataset and shape file are included (and some recordings if you're impatient)
- run
test_setup.pyto make sure you have the system dependencies (or skip it if you're sure you have them already) - run either
bar_chart.pyorgeospatial_map.py- these can be run directly from prompt with something like:
❯ ./bar_chart.py
Along with test_setup.py, if bar_chart.py or geospatial_map.py don't run directly, try giving them executable permission with: chmod +x $FILENAME
This project uses neither virtualenv, rye, or pip freeze for dependency management or encapculation - instead, I found it easier to rely on system libraries, since it allowed access to Tkinter, which I found to be painful trying to install into a venv. That does mean it has the potential to pollute your system libraries if you decide to build it locally. That's also one of the reasons I wanted to make sure its build system was available from within a container. I have another repo I will be releasing soon using the same dataset with a jupyter-notebook, and it relies on venv, but getting Tkinter to work from within venv for this project seemed rather unworkable, so that's the reason for my divergence from a more typical project workflow.
They will be platform-dependent, so I created a script to test your system for the required libraries called test_setup.py. It can be invokved from the terminal directly, e.g.:
❯ ./test_setup.pyIf it does not run directly, try giving it executable permission: chmod +x test_setup.py
As an example, here's what my system is using to run the project:
❯ printf '\nRequired libraries:\n'; pacman -Qq | grep -i -E 'numpy|pandas|geopandas|^tk|colour|matplotlib|ffmpeg'; printf '\nExample platform:\n'; uname -norm; lsb_release -idr

Required libraries:
ffmpeg
ffmpegthumbnailer
python-colour
python-geopandas
python-matplotlib
python-matplotlib-inline
python-numpy
python-pandas
tk

Example platform:
purplehippo 6.9.3-zen1-1-zen x86_64 GNU/Linux
Distributor ID:	Arch
Description:	Arch Linux
Release:	20240613_07h57m
You will need your platform-equivalent of these dependencies linked and available before attempting to run.
The original source of this information can be found here
This dataset is a list of all lobbyist employers and shows compensation/expenses totals for each year they employed lobbyists.
This dataset is a best-effort by the PDC to provide a complete set of records as described herewith and may contain incomplete or incorrect information. The PDC provides access to the original reports for the purpose of record verification.
Descriptions attached to this dataset do not constitute legal definitions; please consult RCW 42.17A and WAC Title 390 for legal definitions and additional information regarding political finance disclosure requirements.
CONDITION OF RELEASE: This publication and or referenced documents constitutes a list of individuals prepared by the Washington State Public Disclosure Commission and may not be used for commercial purposes. This list is provided on the condition and with the understanding that the persons receiving it agree to this statutorily imposed limitation on its use. See RCW 42.56.070(9) and AGO 1975 No. 15.
Last Updated: 08/01/2023 - 10:15am
Explore this dataset at data.wa.gov: https://www.pdc.wa.gov/political-disclosure-reporting-data/open-data/dataset/Lobbyist-Employers-Summary
| Field Name | Data Type | Description |
|---|---|---|
| agg_contrib | number | This is the aggregate total of all non-itemized contributions given by this employer for a specific year. |
| ballot_prop | number | Total of independent expenditures supporting or opposing statewide ballot measures. |
| compensation | number | This column contains an aggregate of all compensation paid to all of an employer's lobbyists for a year. This is the compensation as reported by the lobbyists. When the employer is filing this report, it has the option to change this total if they don't agree. The new total is reflected in the "corr_compensation" column in this dataset. You must review the actual filing to determine the particulars. |
| corr_compensation | number | This column allows the employer to correct the compensation reported by the lobbyists. The lobbyist reports compensation from an employer monthly. The sum of the amounts reported is provided to the employer for verification. If the employer disagrees with the aggregate amount reported by all their lobbyists, the corrected amount is placed in the column. |
| corr_expend | number | This column allows the employer to correct the expenses reported by the lobbyists. The lobbyist reports expenses incurred on behalf of an employer monthly. The sum of the amounts reported is provided to the employer for verification. If the employer disagrees with the aggregate amount reported by all their lobbyists, the corrected amount is placed in the column. |
| Employer_Address | text | The lobbyist employer's address. |
| Employer_City | text | The lobbyist employer's city. |
| Employer_Country | text | The lobbyist employer's country. |
| Employer_Email | text | The lobbyist employer's email address. |
| Employer_Name | text | The employers registered name. The name will be consistent across all records for the same filer id and election year but may differ across years due to a lobbyist changing their name. |
| employer_nid | text | The unique identifier assigned to a lobbyist employer. This filer id is consistent across years. |
| Employer_Phone | text | The lobbyist employer's telephone |
| Employer_State | text | The lobbyist employer's state. |
| Employer_Zip | text | The lobbyist employer's zip code. |
| entertain | number | Total of entertainment, tickets, passes, travel expenses (including transportation, meals, lodging, etc.) and enrollment or course fees provided to legislators, state officials, state employees and members of their immediate families. |
| expenditures | number | This column contains an aggregate of all expenses paid by all of an employer's lobbyists for a year. This is the total of expenses as reported by the lobbyists. When the employer is filing this report, it has the option to change this total if they don't agree. The new total is reflected in the "corr_expend" column in this dataset. You must review the actual filing to determine the particulars. |
| expert_retain | number | Aggregate total paid to or on behalf of expert witnesses or others retained to provide lobbying services who offer specialized knowledge or expertise that assists the employer’s lobbying effort. |
| id | text | PDC internal identifier that corresponds to a lobbyist employers unique filer id combined with the year of registration. For example an id of 17239-2017 represents a record for an employer whose filer id is 17239 for calendar year 2017. |
| ie_in_support | number | Aggregate total of independent expenditures supporting or opposing a candidate for legislative or statewide executive office or a statewide ballot measure. |
| inform_material | number | Aggregate total for composing, designing, producing and distributing informational materials for use primarily to influence legislation. |
| itemized_exp | number | Aggregate total of any expenditures, not otherwise reported, made directly or indirectly to a state elected official, successful candidate for state office or member of their immediate family, if made to honor, influence or benefit the person because of his or her official position. |
| l3_nid | text | This |
| lobbying_comm | number | Aggregate total for grass roots lobbying expenses, including those previously reported by employer on Form L-6, and payments for lobbying communications to clients/customers (other than to corporate stockholders and members of an organization or union). |
| other_l3_exp | number | The aggregate of other lobbying-related expenditures, whether through or on behalf of a registered lobbyist. Does not include payments previously accounted for. |
| political | number | The aggregate total of all itemized contributions made in a specific year. |
| total_exp | number | This field is a calculated field adding the expenses reported by the employer. It combines the following columns: expenditures + agg_contrib + ballot_prop + entertain + vendor + expert_retain + inform_material + +lobbying_comm + ie_in_support + itemized_exp + other_l3_exp + political. NOTE: THE "CORR_EXPEND" FILED IS NOT USED IN THIS CALCULATION. |
| vendor | number | Aggregate total paid to vendors on behalf of or in support of registered lobbyists (e.g., entertainment credit card purchases). |
| Year | number | The calendar year in which an employer hired a lobbyist. |
Geographic boundary files - United States outline: https://www.census.gov/geographies/mapping-files/time-series/geo/cartographic-boundary.html
Tiny web server written in go on gist.github.com:
matplotblog: https://matplotlib.org/matplotblog
matplotlib user manual: https://matplotlib.org/stable/users/index.html
nuCamp coding bootcamp Python DevOps course: https://www.nucamp.co/bootcamp-overview/back-end-sql-devops-python
Trenton McKinney answering question about animating with a shapefile on Stack Overflow: https://stackoverflow.com/questions/78609465/animating-yearly-data-from-pandas-in-geopandas-with-matplotlib-funcanimation
Mini-tutorial for mapping population growth: https://www.youtube.com/watch?v=2isVrKpAx6Q
Mini-tutorial for animated time series: https://www.youtube.com/watch?v=K1LezPnJZtk

