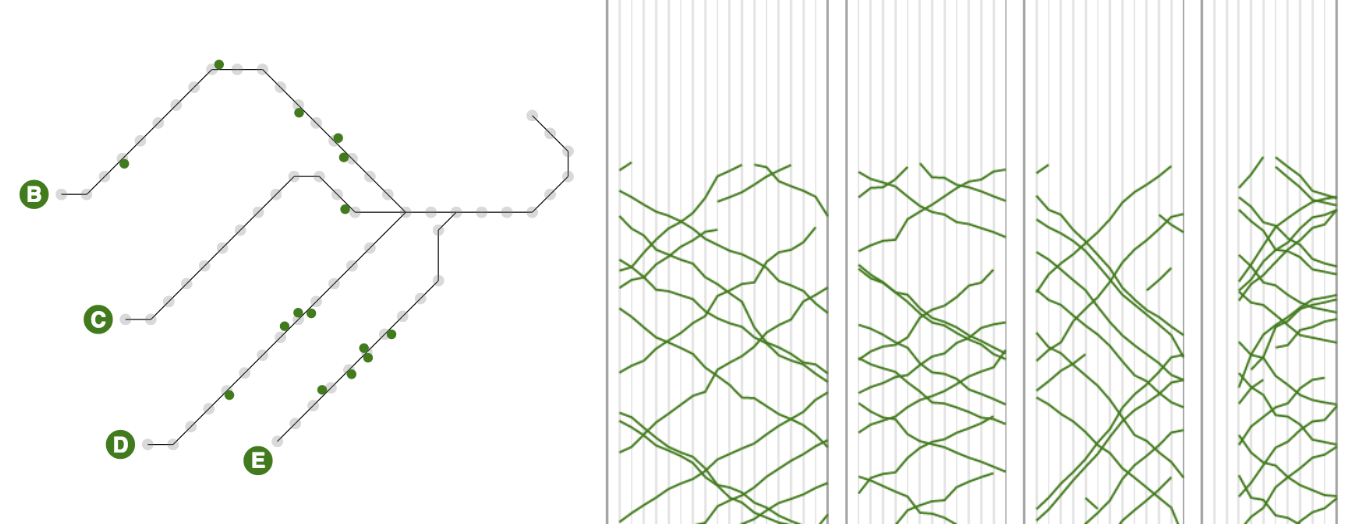
When we built Visualizing MBTA Data to help explain Boston's Subway System, there was no data available for the Green Line. The MBTA began publishing that data in October, 2014. This project is a web-based interactive look inside the first data that began to flow for the Green Line.
Check it out: http://mbtaviz.github.io/green-line-release.
This code is largely based on https://github.com/mbtaviz/mbtaviz.github.io.
-
Install node.js
-
Install
bowerto grab dependencies,lessto compile style sheets andhttp-serverto run the websitenpm install -g bower less http-server -
Install dependencies
bower install -
Compile less css files into a single stylesheet
lessc --clean-css styles/main.less > styles/main.css -
Serve up the website
http-server -
Browse to http://localhost:8080/ to see the visualization
data\                post-processed visualization data
scripts\             JavaScript files for the visualization and the website
styles\              less CSS stylesheets and main.css that they are compiled into
media\               Opengraph/Twitter Card images
bower.json           bower dependencies
ie.png               website rendered to an image for browsers without svg support
index.html           landing page
README.md            README file that appears on the website's github page
The visualization loads main.css which is generated from all of the less
files in the styles/ directory. If you change any of the less stylesheets
use the less compile to regenerate main.css as described above:
lessc --clean-css styles/main.less > styles/main.css
For more information see http://lesscss.org.
Mike Barry
Brian Card
Copyright 2014 Michael Barry and Brian Card.
JavaScript source files and less stylesheets released under the MIT License.
All other files including this README, the main web page, and images made available under Github's terms of service
