Simple, lightweight chart PNG generator using Chart.js and Canvas.
Chart.js is a super flexible and advanced javascript charting library. It works flawlessly in the browser, but sometimes you need to have a static chart image, for example: to embed in an email.
And here's the corresponding static image.
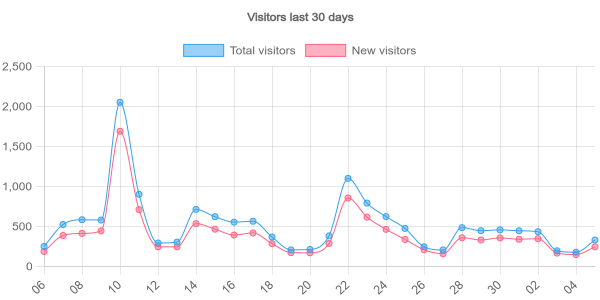
There are a couple of existing options, but they ship a lot of code and are fiddly to set up.
chart-canvas just puts together chart.js, node-canvas and express and is supplied with an easy to setup Docker image.
Build image:
docker build -t chrishow/chart-canvas .
Run image:
docker run -d -p 127.0.0.1:3000:3000 --name chart-canvas chrishow/chart-canvas
Take your chart.js config, for example:
{
	type: 'line',
	data: {
		labels: ['06','07','08','09','10','11','12','13','14','15','16','17','18','19','20','21','22','23','24','25','26','27','28','29','30','01','02','03','04','05', ],
		datasets: [
			{
				label: 'Total visitors',
				data: [ 249,523,583,579,2051,901,292,303,712,621,553,564,367,206,211,381,1100,791,622,475,245,205,484,446,456,445,433,195,177,305, ],
				borderWidth: 1
			}, {
				label: 'New visitors',
				data: [ 186,386,412,444,1689,709,245,244,534,465,392,418,284,172,170,286,855,616,463,337,208,158,358,330,356,339,346,166,148,183, ],
				borderWidth: 1
			}
			]
		},
	options: {
		plugins: {
			title: {
				display: true,
				text: 'Visitors last 30 days'
			},
			legend: {
				display: true
			}
		},
		scales: {
			y: {
				beginAtZero: true
			}
		},
		cubicInterpolationMode: 'monotone',
		tension: 0.4,
	}
}
Base64 encode the config to produce this:
eyJ0eXBlIjoibGluZSIsImRhdGEiOnsibGFiZWxzIjpbIjA2IiwiMDciLCIwOCIsIjA5IiwiMTAiLCIxMSIsIjEyIiwiMTMiLCIxNCIsIjE1IiwiMTYiLCIxNyIsIjE4IiwiMTkiLCIyMCIsIjIxIiwiMjIiLCIyMyIsIjI0IiwiMjUiLCIyNiIsIjI3IiwiMjgiLCIyOSIsIjMwIiwiMDEiLCIwMiIsIjAzIiwiMDQiLCIwNSJdLCJkYXRhc2V0cyI6W3sibGFiZWwiOiJUb3RhbCB2aXNpdG9ycyIsImRhdGEiOlsyNDksNTIzLDU4Myw1NzksMjA1MSw5MDEsMjkyLDMwMyw3MTIsNjIxLDU1Myw1NjQsMzY3LDIwNiwyMTEsMzgxLDExMDAsNzkxLDYyMiw0NzUsMjQ1LDIwNSw0ODQsNDQ2LDQ1Niw0NDUsNDMzLDE5NSwxNzcsMzI5XSwiYm9yZGVyV2lkdGgiOjF9LHsibGFiZWwiOiJOZXcgdmlzaXRvcnMiLCJkYXRhIjpbMTg2LDM4Niw0MTIsNDQ0LDE2ODksNzA5LDI0NSwyNDQsNTM0LDQ2NSwzOTIsNDE4LDI4NCwxNzIsMTcwLDI4Niw4NTUsNjE2LDQ2MywzMzcsMjA4LDE1OCwzNTgsMzMwLDM1NiwzMzksMzQ2LDE2NiwxNDgsMjQ0XSwiYm9yZGVyV2lkdGgiOjF9XX0sIm9wdGlvbnMiOnsicGx1Z2lucyI6eyJ0aXRsZSI6eyJkaXNwbGF5Ijp0cnVlLCJ0ZXh0IjoiVmlzaXRvcnMgbGFzdCAzMCBkYXlzIn0sImxlZ2VuZCI6eyJkaXNwbGF5Ijp0cnVlfX0sInNjYWxlcyI6eyJ5Ijp7ImJlZ2luQXRaZXJvIjp0cnVlfX0sImN1YmljSW50ZXJwb2xhdGlvbk1vZGUiOiJtb25vdG9uZSIsInRlbnNpb24iOjAuNH19
Now pass this to the graph endpoint, eg:
http://localhost:3000/graph/eyJ0eXBlIjoibGluZ...
The URL will point to a png of the required graph image.
In production, you will probably want to put this behind a rate-limiting reverse proxy.