[Update] Sangrenel is currently being updated. Take note of issues.
"...basically a cloth bag filled with small jagged pieces of scrap iron"
Sangrenel is Kafka cluster load testing tool. Sangrenel was originally created for some baseline performance testing, exemplified in my Load testing Apache Kafka on AWS blog post.
While using this tool, keep in mind that benchmarking is always an examination of total systems performance, and that the testing software itself is part of the system (meaning you're not just testing Kafka, but Kafka+Sangrenel).
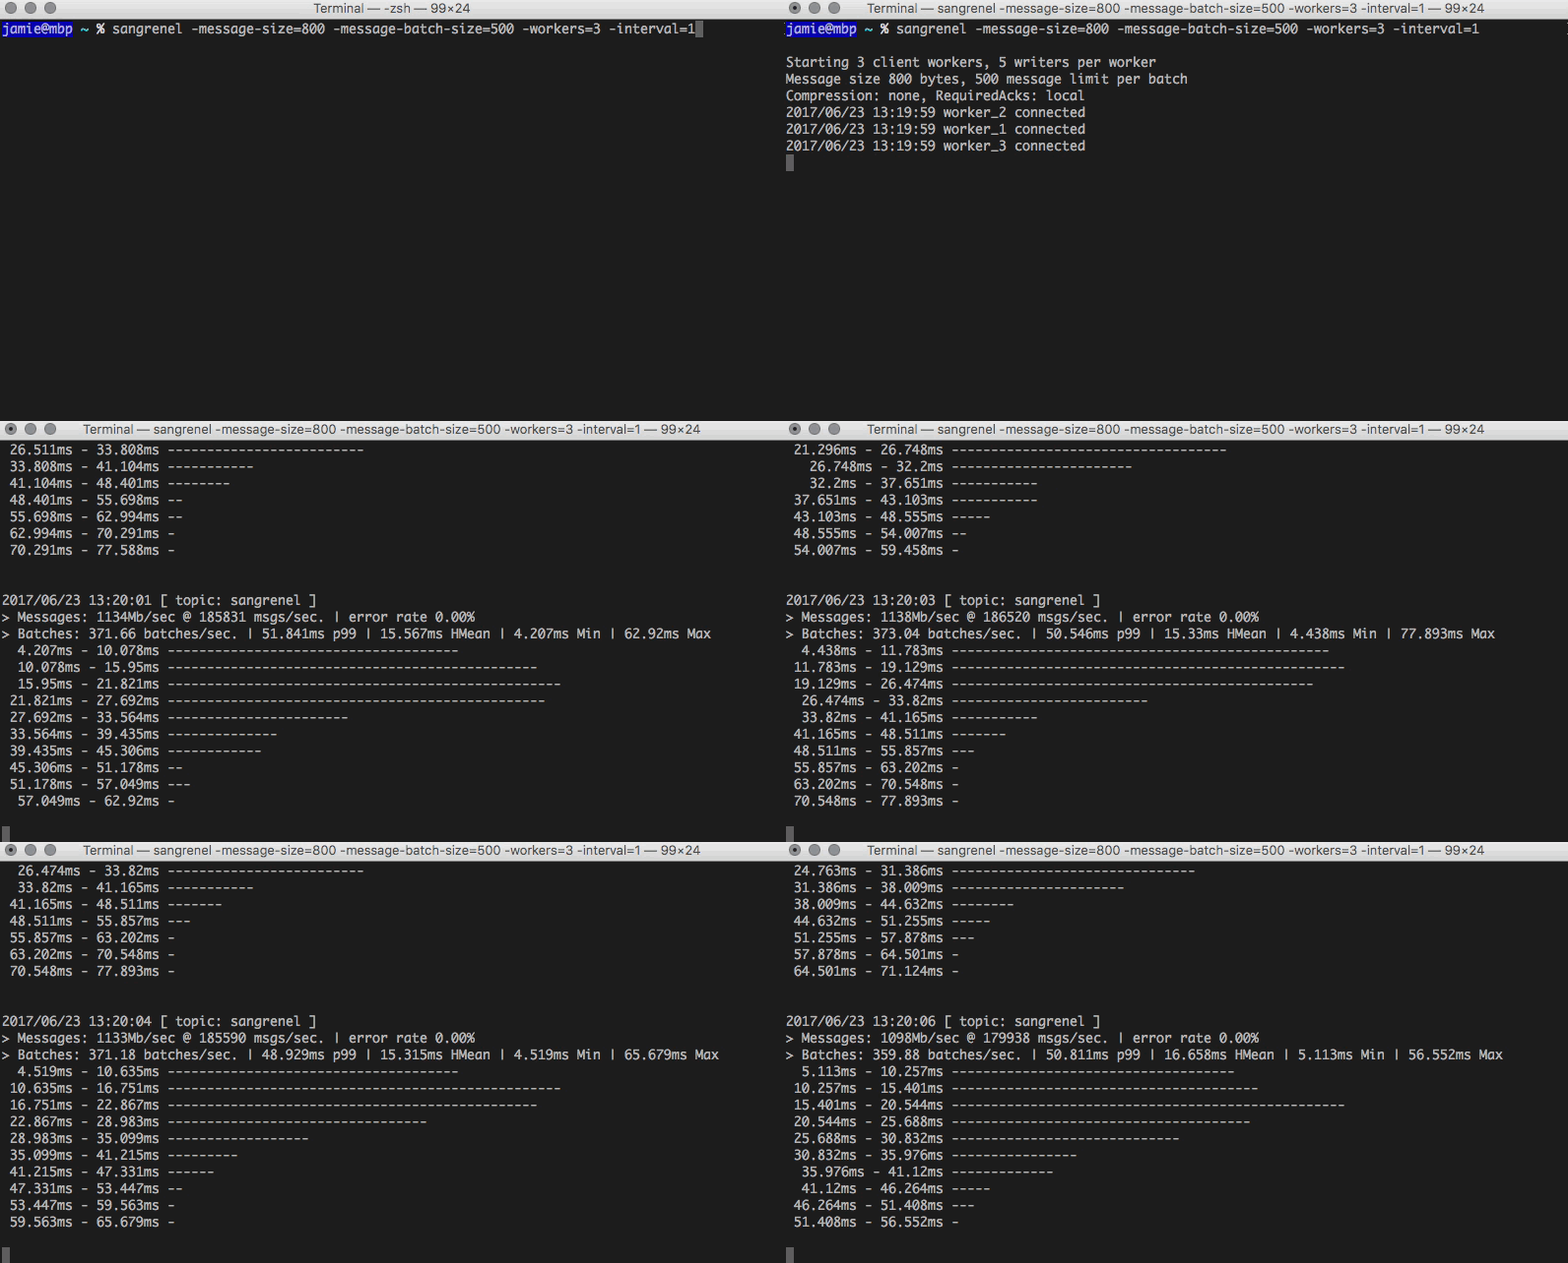
Sangrenel takes configurable message/batch sizing, concurrency and other settings and writes messages to a reference topic. Message throughput, batch write latency (p99, harmonic mean, min, max) and a latency histogram are dumped every 5 seconds.
Assuming Go is installed (tested with 1.7+) and $GOPATH is set:
go get -u github.com/jamiealquiza/sangrenelgo install github.com/jamiealquiza/sangrenel
Binary will be found at $GOPATH/bin/sangrenel
Usage output:
Usage of sangrenel:
  -api-version string
    	Explicit sarama.Version string
  -brokers string
    	Comma delimited list of Kafka brokers (default "localhost:9092")
  -compression string
    	Message compression: none, gzip, snappy (default "none")
  -graphite-ip string
    	Destination Graphite IP address
  -graphite-metrics-prefix string
    	Top-level Graphite namespace prefix (defaults to hostname) (default "ja.local")
  -graphite-port string
    	Destination Graphite plaintext port
  -interval int
    	Statistics output interval (seconds) (default 5)
  -message-batch-size int
    	Messages per batch (default 500)
  -message-size int
    	Message size (bytes) (default 300)
  -noop
    	Test message generation performance (does not connect to Kafka)
  -produce-rate uint
    	Global write rate limit (messages/sec) (default 100000000)
  -required-acks string
    	RequiredAcks config: none, local, all (default "local")
  -topic string
    	Kafka topic to produce to (default "sangrenel")
  -workers int
    	Number of workers (default 1)
  -writers-per-worker int
    	Number of writer (Kafka producer) goroutines per worker (default 5)
Sangrenel uses the Kafka client library Sarama. Sangrenel starts one or more workers, each of which instantiate a unique Kafka client connection to the target cluster. Each worker has a number of writers which generate and send message data to Kafka, sharing the parent worker client connection. The number of workers is configurable via the -workers flag, the number of writers per worker via the -writers-per-worker. This is done for scaling purposes; while a single Sarama client can be used for multiple writers (which live in separate goroutines), performance begins to flatline at some point. It's best to leave the writers-per-worker at the default 5 and scaling the worker count as needed, but the option is exposed for more control. Left as a technical exercise for the user, there's a different between 2 workers with 5 writers each and 1 worker with 10 writers.
The -topic flag specifies which topic is used, allowing configs such as parition count and replication factor to be prepared ahead of time for performance comparisons (by switching which topic Sangrenel is using). The -message-batch-size, -message-size and -produce-rate flags can be used to dictate message size, number of messages to batch per write, and the total Sangrenel write rate. -required-acks sets the Sarama RequiredAcks config. The -api-version flag allows Sarama to be configured at a specific API level (See the version field of the Sarama Config struct). The supported API versions are: "0.8.2.0", "0.8.2.1", "0.8.2.2", "0.9.0.0", "0.9.0.1", "0.10.0.0", "0.10.0.1", "0.10.1.0", "0.10.2.0", "0.11.0.0", "1.0.0.0".
Two important factors to note:
- Sangrenel uses Sarama's SyncProducer, meaning messages are written synchronously
- At a given message size, Sangrenel should be tested in
-noopmode to ensure the desired number of messages can be generated (even if a-produce-rateis specified)
Once running, Sangrenel generates and writes messages as fast as possible (or to the configured -produce-rate). Every 5 seconds, message throughput, rates, latency and other metrics (via tachymeter) are printed to console.
If optionally defined, some metric data can be written to Graphite. Better metric output options will be added soon.
