The U-Net is a convolutional neural network (CNN) architecture developed for biomedical image segmentation, but it can be applied to other image segmentation tasks as well. It was first introduced in 2015 by Olaf Ronneberger, Philipp Fischer, and Thomas Brox from the University of Freiburg, Germany.
This repository was created to implementat the U-Net architecture from scratch and train it on two publicly available datasets, Kvasir-SEG and CARAVANA.
The consequent step was to implement the attention mechanism from the paper "Attention U-Net" in order to build a solid understanding of the same.
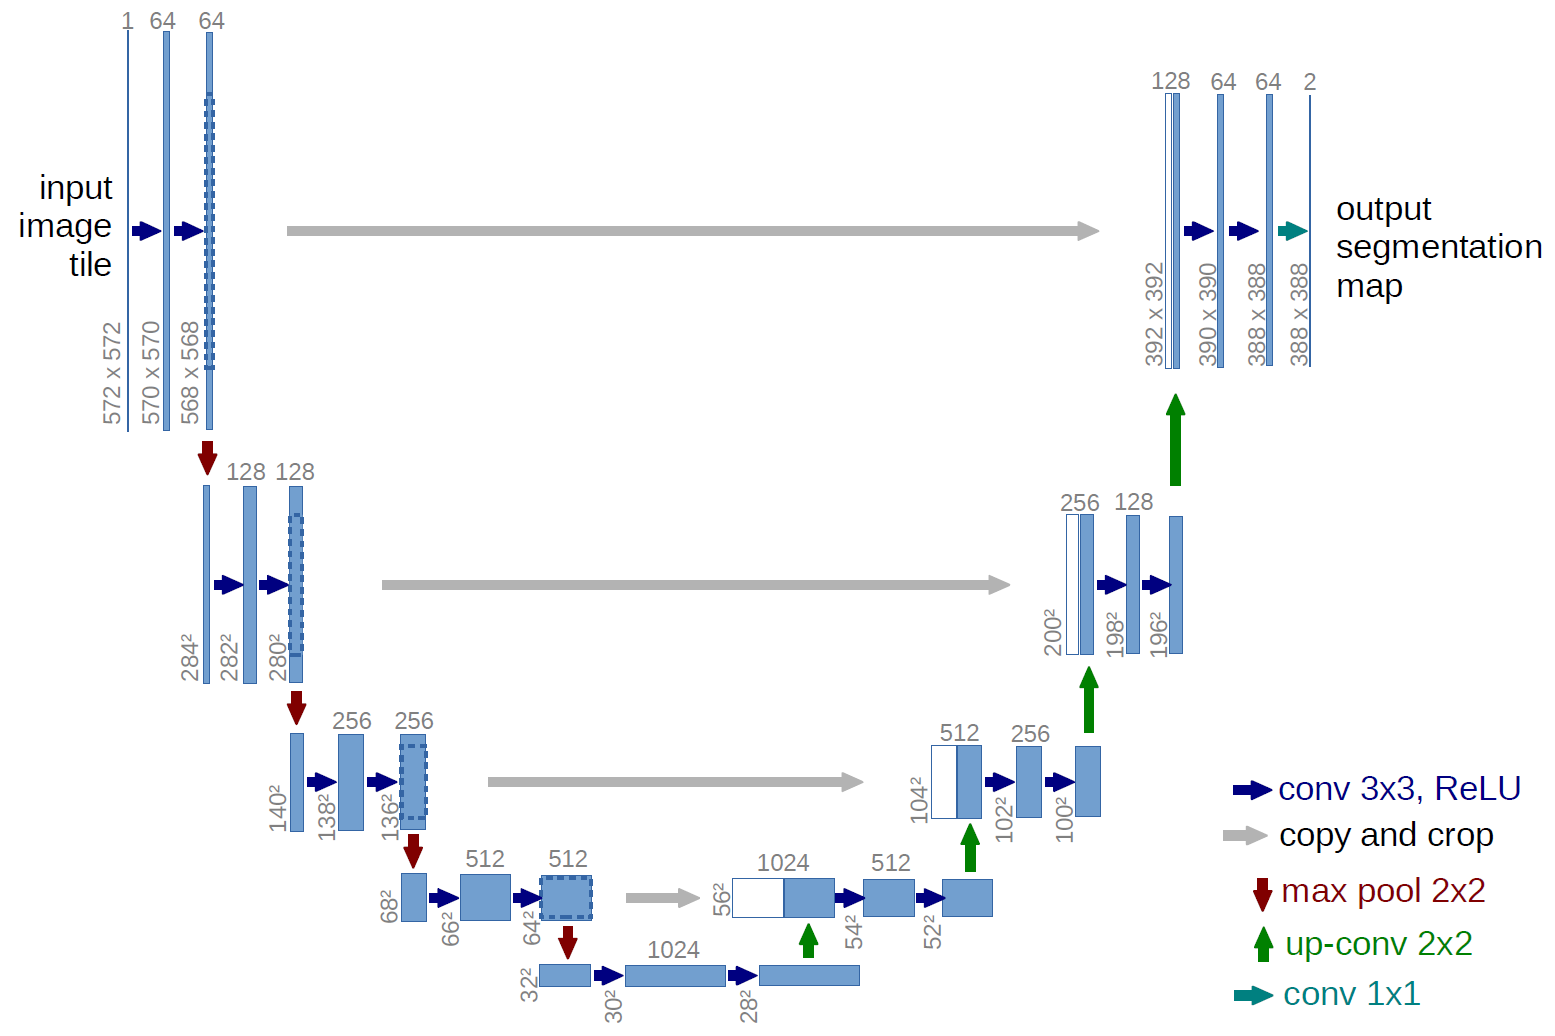
The U-Net architecture consists of two parts: the contracting path and the expanding path. The contracting path is a typical CNN architecture that performs convolution and pooling operations to reduce the spatial size of the input image while increasing the number of feature maps. This path is responsible for capturing the context of the image.
The expanding path, on the other hand, uses upsampling and concatenation operations to increase the spatial size of the feature maps while reducing their depth. This path is responsible for precise localization of the objects in the image.
The two paths are connected through skip connections that allow the model to retain important spatial information that is lost during the pooling and downsampling operations of the contracting path. These skip connections allow the model to accurately localize the segmented objects in the image.
I implemented this with my own understanding which worked very well. However, I found Alladin's implementation to be cleaner and ingeneous so I picked up his model implementation and added it to this repository.
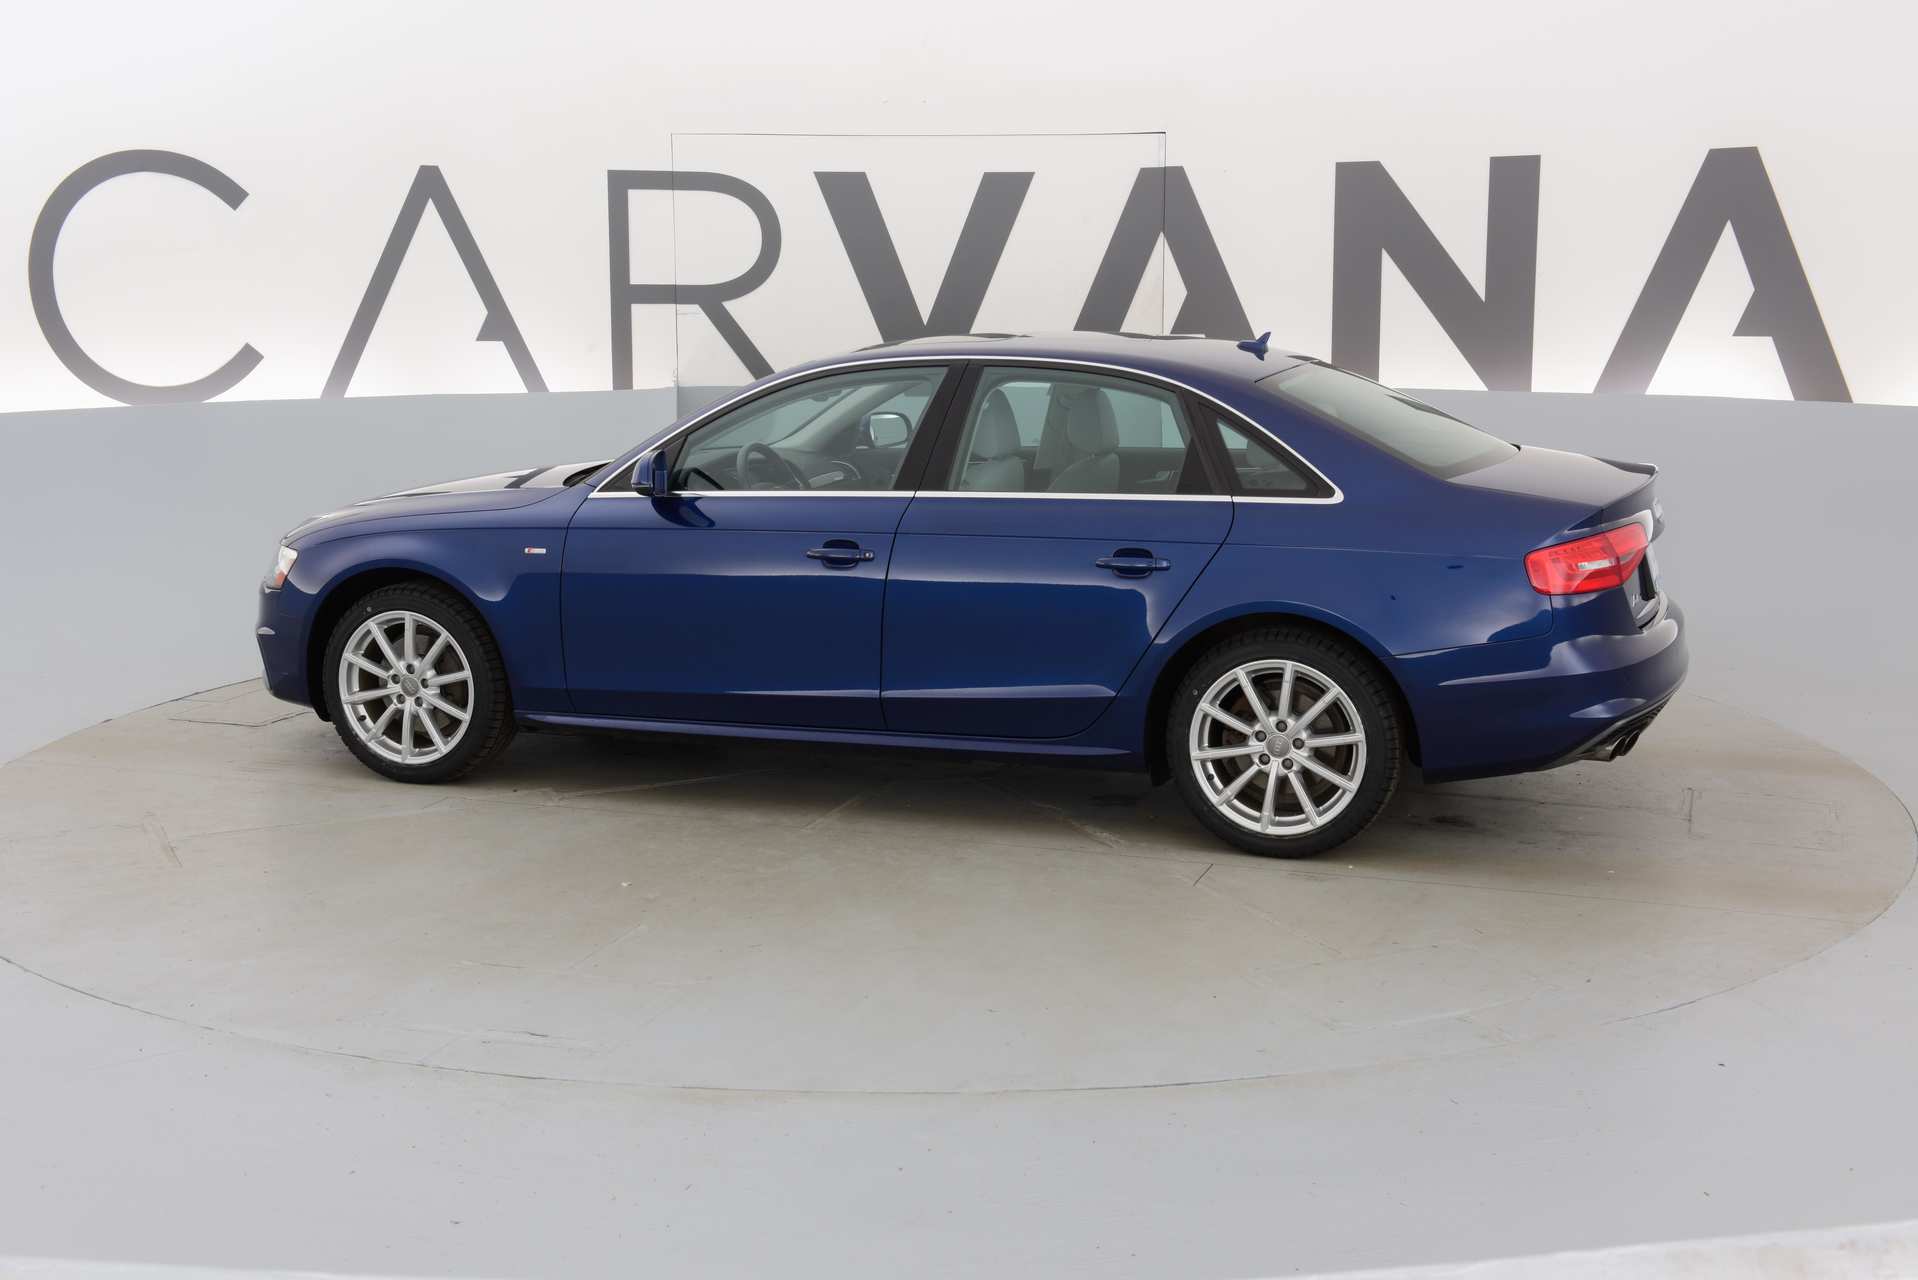
Before testing the implementation of U-Net on the Kvasir-SEG dataset, I decided to test it on the CARAVANA dataset. The reason behind this decision was that the CARAVANA dataset is slightly more balanced than the Kvasir-SEG dataset and I wanted to start off with a dataset that is more balanced in terms of class distribution before moving to a more challenging dataset like Kvasir-SEG.
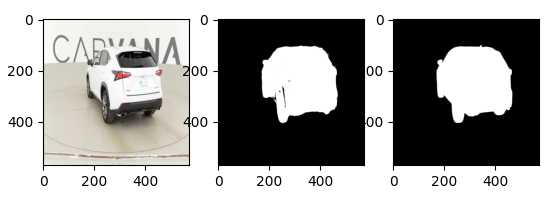
Here's an example of an instance and it's corresponding masks from the CARAVANA dataset
And here's an example of an instance from the Kvasir-SEG dataset
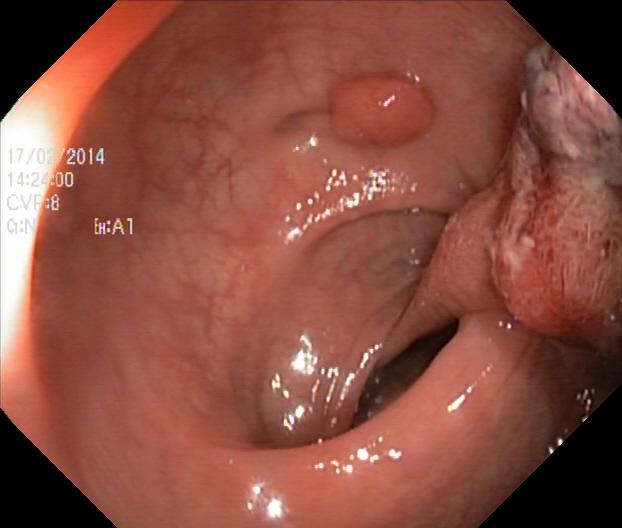
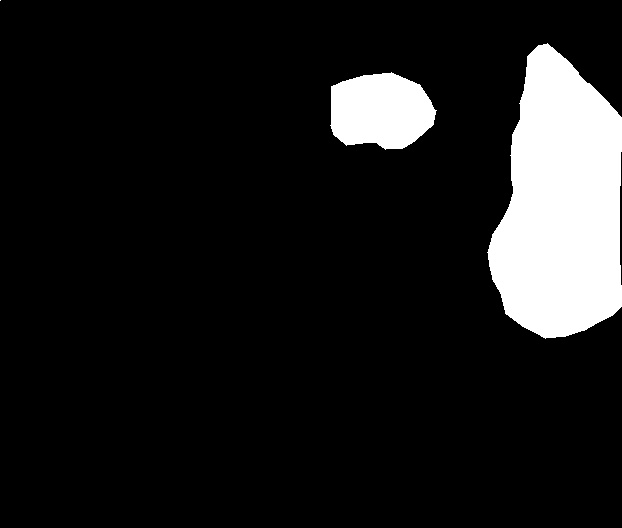
As can be observed, the Kvasir segmentation dataset is highly imbalanced. To compensate for this, I implemented Dice Loss as opposed to cross entropy loss mentioned in the paper.
Dice loss addresses the issue of imbalance by focusing on the overlapping regions between the predicted and ground truth segmentation masks. It calculates the overlap between the two masks as the Dice coefficient, which is a measure of similarity between two sets. The Dice coefficient is defined as twice the intersection of the two sets divided by the sum of their sizes.
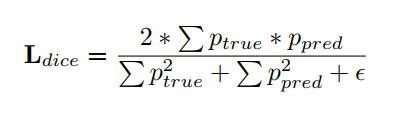
I must admit that I spend a couple of days wondering why my model training was stuck at a sub-optimal point. The error was in the implementation of my dice loss. The correct formula for Dice Loss is shown above.
I trained two U Net model architectures on Google Colab, one with attention mechanism and one without. Due to its GPU usage policy, I restricted the training to a single epoch. This did not affect my analysis much as I was observing and comparing loss on their entire set of training data and the model converged in the first epoch itself.
The training specifications can be seen here:
Optimizer: SGD with momentum
Learning rate: 0.001 (constant)
Momentum: 0.99
Dataset: Caravana
Data augmentation: Rotation only
Here are the metrics after the first epoch
Average Dice Loss (vanilla model): 0.05282546548323471 +- 0.1040327460257257
Average Dice Loss (with attention gates): 0.041662404339250496 +- 0.08821413838657734
Below is the inference output by the trained model.
The image on the left is the instance to be segmented, the image in the centre is the output of the model while image on the right is the ground truth segmentation mask.