Live Demo
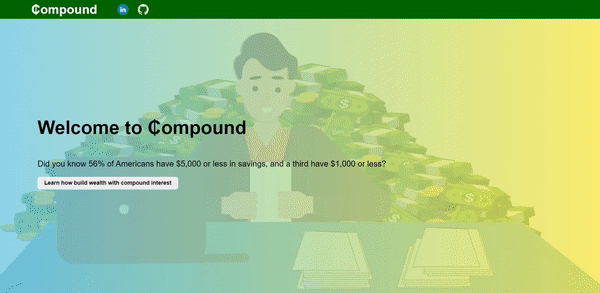
Compound is an app that lets you plan your financial future. Just drag and drop some information into your plan and it will generate an investing plan and budget for you!
JavaScriptD3.jsfor data visualizationWebpackto bundle JS filesAlpha Vantage APIto fetch index fund data
- Drag and drop information into drop zone
- Have a button to take all the tags in drop zone and display a graph and budget
- Display graph and budget using D3
- Beautiful and function UI/UX by using animations and CSS for graphs, buttons, and parallax slider on landing

I use Vanilla Javascript drag and drop to match users with the perfect fund based on their risk, age, income, and retirement plans. Once all the droppable containers are filled with dropped HTML elements the match fund button appears and queries the Alpha Vantage API endpoint for the matched index fund.
function fetchStockData(fundTicker, info) {
  let chartAPIurl = `https://www.alphavantage.co/query?function=TIME_SERIES_DAILY&symbol=${fundTicker}&apikey=${APIkey}`;
  let dataObj = [];
  fetch(chartAPIurl)
    .then((response) => {
      return response.json();
    })
    .then((data) => {
      for (let point in data["Time Series (Daily)"]) {
        dataObj.push({
          value: parseFloat(data["Time Series (Daily)"][point]["1. open"]),
          date: d3.timeParse("%Y-%m-%d")(point),
        });
      }
      displayGraph(dataObj, info);
    });
}
This code shows how I fetch the live stock data from Alpha Vantage's REST API endpoint using the Vanilla Javascript fetch() method and format it to be displayed by D3. This is my second application using an external API to display live stock data. I have a strong understanding of fetching data from an external API and formatting the response data to be displayed.

When clicking on the match fund button a graph using D3.js is rendered with the fund's current price from the last 4 months. There is a smooth scroll button that will scroll down to two additional D3.js graphs. The top graph is a compound interest graph showing you how much you will have if you follow a strict budget and invest your income. The bottom graph is a automatically generated budget that suggests how much you should spend on each category. There is a listener on scroll that animates all the graph lines when scrolling either up or down.


- Setup drag and drop
- Started with styling the home page
- Matched tags from drag and drop with fund and grab data using API
- Learned how to use D3
- Displayed fund chart and info
- CSS styling for chart and info
- Added slide in for chart and info
- Added compound interest chart based on dropped tags
- Created linked budget breakdown for optimal savings
- Allowed changes in data from budget display in chart
- Used user data from matched fund to calculate compounded interest and value
- Continue working on all features
- Cleaned up code and find bugs
- Added more styling
- Finished production README