-
Notifications
You must be signed in to change notification settings - Fork 5
Tutorial 4
This tutorial will cover loading a DICOM directory and visualizing a static series.
-
Start Eidolon and then select from the menu "Import" -> "Dicom Directory"
-
Select the ''tutorial/DicomData'' directory and click "Choose"/"OK"
-
This will bring up the Choose DICOM Series dialog box. Select the single series that should show up and click OK.
-
Click on the loaded object and create a Timed Image Stack representation. This should appear like this:

-
The images will appear in the render window aligned in the correct orientations. Click on the representation to bring up its properties dialog.
-
Click the checkbox "Select Slice" to show only a single slice at a time. Move the Slice slider to select which slice is seen.
-
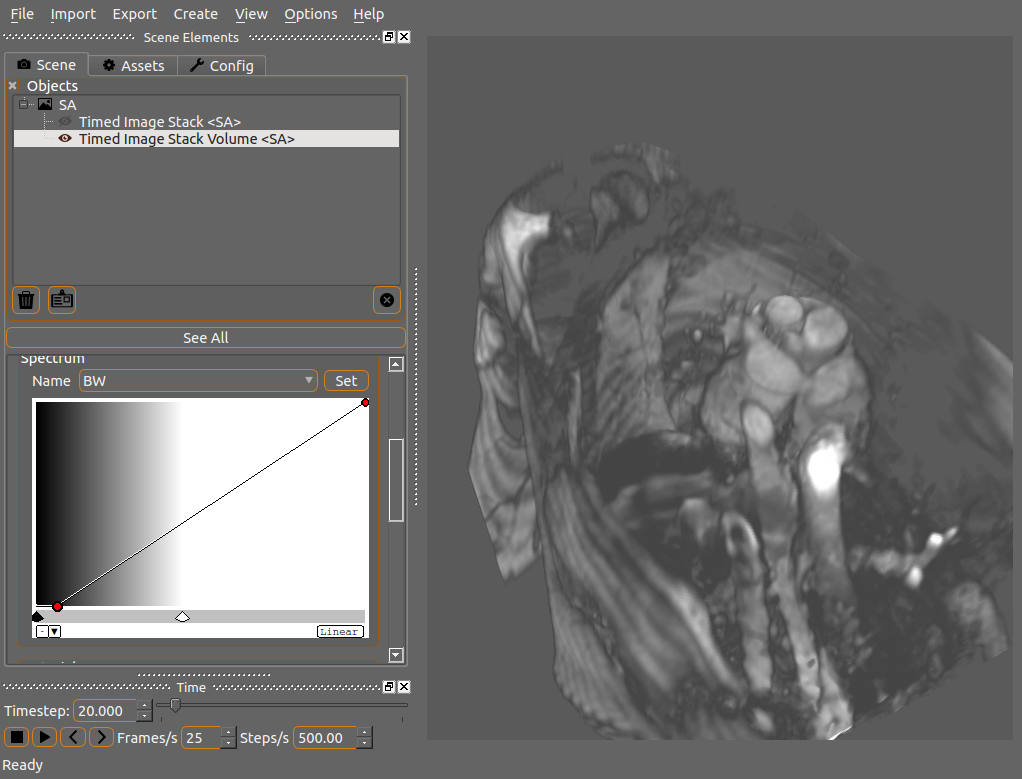
This representation is rendered as a series of 2D planes as defined by the DICOM data, however these images do form a stack so rendering as a volume is possible. Double-click on the current representation to toggle its visibility then create a new one of type Timed Image Stack Volume. This should appear like this:

- This is very dark since there's a lot of low-intensity data. Click on the representation and move the spectrum's colour carets and transparency curves around to get different results, eg.:
